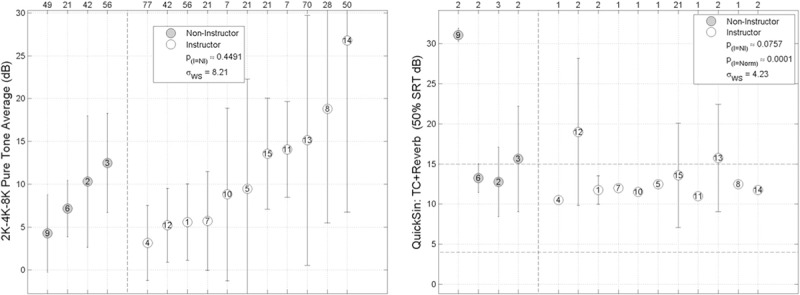
Figure 4.

Individual 2k-4k-8 kHz pure tone average scores (left panel) and individual thresholds on the Reverb+TC condition (right panel) of the QuickSIN Speech-in-Noise Test. The red lines in the right panel show the expected range for Quick SIN Reverb+TC for normal hearing listeners. The left panel shows the pure-tone thresholds sorted from left to right by increasing threshold, and the right panel shows performance on the Reverb+TC condition of the QuickSin. Results show that performance was particularly poor for listener number 9, who had some of the best audiometric thresholds in the group, but consistently performed much worse than the other subjects in the task. This subject also struggled at some of the other speech perception and central auditory processing tasks, and tended to have highly variable results across all the experiments. Three other listeners (3, 12 and 13) also performed outside of the normal range. Two of these listeners (3 and 13) had elevated hearing thresholds that might have accounted for the poor performance
