

Abstract
Purpose:
To study the effects of filtration surgeries (tube and trabeculectomy) on changes in intraocular pressure after a water-drinking test.
Methods:
In this prospective, non-randomized, comparative clinical study, 30 patients who had tube surgery and 30 age- and sex-matched trabeculectomy patients underwent a water-drinking test. Only one eye of each patient was included. The baseline intraocular pressure was ≤21 mmHg in all enrolled eyes with or without adjunctive topical medications. After the water-drinking test, the intraocular pressure was measured and recorded at 15, 30, 45, and 60 minutes and the results were compared between the two groups.
Results:
In both groups, intraocular pressure significantly increased from baseline at all measured time-points (P < 0.001). In the trabeculectomy group, the average intraocular pressure increased from 14.8 ± 2.9 to 18.8 ± 4.7 mmHg at 30 minutes, but decreased at 60 min (18.0 ± 5.2 mmHg). In the Tube group, intraocular pressure increased incrementally until the last measurement (14.2 ± 3.9, 18.8 ± 5.6, and 19.7 ± 6.0 mmHg at baseline, 30, and 60 minutes, respectively). The end-pressure difference (intraocular pressure at 60 minutes vs. baseline) was significantly greater in the tube group (5.6 ± 3.6 mmHg; 41% change) than in the trabeculectomy group (3.2 ± 4.7; 23% change; P = 0.03).
Conclusion:
Intraocular pressure significantly increased after the water-drinking test in both the groups. Intraocular pressure started to decline 30 minutes after the water-drinking test in the trabeculectomy group, while it continued to increase up to 60 minutes in the Tube group. This finding may have implications regarding the efficacy or safety of the procedures in advanced glaucoma patients.
Keywords: Intraocular Pressure, Trabeculectomy, Tube, Water-drinking Test
INTRODUCTION
The major goal in glaucoma management is lowering intraocular pressure (IOP) to a safe level (target IOP) in order to prevent further optic nerve damage. A lower target IOP is needed (due to fragility of the already damaged optic nerve) when a greater degree of damage is present.[1] In addition to IOP and IOP-independent factors that are important in glaucoma progression, the fluctuation of IOP has also been suggested to play a major role.[2,3] It was demonstrated that about one-third of patients with normal single IOP measurements at office hours had pressure peaks detected only during a 24-hour diurnal curve assessment.[4] Studies have shown that the IOP peak of most untreated and treated glaucoma patients occurs during the nocturnal/sleep period.[5,6] Relying on office IOP measurements will not be accurate in patients with highly variable IOP, particularly those with nocturnal peaks. Checking a 24-hour diurnal curve, modified diurnal tension curve (4 to 5 IOP measurements during office hours from 8 AM to 6 PM), home tonometry, contact lens sensor, and the water-drinking test (WDT) have been suggested as tools for determining the diurnal curve.[7,8,9] Most of the aforementioned tools are not always feasible, except the WDT.
Five decades ago, the WDT was a popular diagnostic test for glaucoma, but later discontinued because of low sensitivity and specificity.[10] The emphasis on the value of this test has changed now. The IOP peaks detected during the WDT correlate well with the peaks detected during diurnal tension curves.[11,12] It is believed that the WDT is an index of outflow facility representing the conductivity out of the anterior chamber.[13] A treatment that improves the outflow facility can be expected to result in smaller diurnal IOP fluctuation.[14] WDT has been suggested as a tool for assessing the efficacy of clinical or surgical therapy for the prevention of intraocular pressure spikes.[15] The “Tube Versus Trabeculectomy (TVT)” study demonstrated a higher success rate with the tube surgery when compared to that of the trabeculectomy with mitomycin C after five years.[16] Since the publication of the TVT study, a trend toward tube surgery with a proportional decrease in trabeculectomy surgery has been observed.[17] Currently, tube surgery is advocated as the primary surgery in fit candidate.[18] Recent Medicare data and surveys of glaucoma specialists demonstrates a trend toward tube surgery with a concurrent decrease in the frequency of trabeculectomy surgery since the publication of the TVT.[17] A review of the Medicare Current Procedural Terminology codes showed that between 1995 and 2004, the volume of trabeculectomy surgery decreased by 43%, whereas that for tube surgeries increased by 184%.[19]
With respect to the rising popularity of tube surgery, it would be interesting to find out how the WDT response (as an index for outflow facility[20,21]) for this procedure differs from that of the trabeculectomy.
METHODS
Study Population
This prospective, non-randomized, comparative clinical study was conducted in a tertiary eye care hospital on patients that were treated with either trabeculectomy or tube surgery and had an IOP equal to or below the established target pressure (21 mmHg) with or without glaucoma medications based on isolated office readings. All surgical procedures were performed by one surgeon (MRR). The tube group (Tube) had an Ahmed Glaucoma Valve (FP7, New World Medical, Rancho Cucamonga, LA, USA) and the trabeculectomy group (Trab) had a procedure with adjunctive mitomycin C (0.2 mg/ml for 2 minutes). Both groups had at least 6 months of follow-up after surgery. All patients underwent a complete ophthalmological examination including a Snellen visual acuity (VA) test, IOP measurement, and a dilated stereoscopic fundus examination to assess the amount of damage to the optic nerve head using Disc Damage Likelihood Scale.[22] The average thickness of the retinal nerve fiber layer by optical coherence tomography; mean deviation and pattern standard deviation of Humphrey visual field were recorded. The exclusion criteria were a previous refractive surgery or laser trabeculoplasty, presence of ocular infection at the time of study, any corneal abnormalities preventing a reliable IOP measurement, more than one trabeculectomy or tube surgery, follow-up less than 6 months after trabeculectomy or tube surgery, pregnancy, cardiac or renal diseases, and history of urinary retention.
Water-drinking Test
The patients refrained from fluid or food ingestion 3 hours before the WDT. After checking the IOP (IOP baseline), patients ingested 1 liter of bottled water (15 mL/kg for patients <16 years, because of lower weight and body mass index compared to adults[23,24]) in 5 minutes. Then, IOP was measured every 15 minutes for one hour. Overall, five IOP measurements were performed (baseline, 15, 30, 45, and 60 minutes). One examiner measured the IOPs with a non-contact tonometer (CT80; Topcon Co., Tokyo, Japan). The average of 3 measurements was recorded; the measurement was repeated if the difference between 3 measurements was greater than 3 mmHg. In a recent meta-analysis on a comparison of all available tonometers with a Goldmann Applanation Tonometer, the least amount of variability in IOP measurement (mean difference of 0.2 mmHg) was seen with non-contact tonometers.[25] The following parameters were obtained from both groups: IOP peak (highest IOP after drinking water), IOP trough (the lowest IOP after drinking water), IOP mean (the mean of the 4 IOPs after drinking water), IOP fluctuation (difference between IOP peak and baseline), IOP range (difference between IOP peak and IOP trough after drinking water), end-pressure difference (IOP at 60 minutes versus baseline).
Statistical Analysis
IOP was measured in both eyes; if both eyes met the eligibility criteria, one eye was randomly selected for inclusion in the study. All data were recorded and analyzed using IBM SPSS statistics software version 21 (SPSS Inc., Chicago, IL). Descriptive results were presented as the mean ± standard deviation (SD). IOP fluctuation after WDT at different time-points in each group was analyzed using repeated-measures ANOVA. An independent T-test was used to compare the IOP changes between the two groups. AP value of <0.05 was considered statistically significant.
RESULTS
Overall, data from 30 patients who underwent trabeculectomy and 30 patients who underwent tube surgery were compared. Baseline characteristics of the patients in each group are shown in Table 1. The two groups were not statistically different for most baseline parameters including age, sex, weight, height, body mass index, refractive error, severity of glaucoma, baseline IOP, and number of topical medications. However, compared to the Trab group, the Tube group had a higher proportion of cases with primary closed angle glaucoma (PCAG), pseuduoexfoliative glaucoma, and congenital glaucoma. In the Trab group, 66.7% were phakic, and in the Tube group, 56.7% were pseudophakic [Table 1]. However, in linear regression analysis, no statistically significant association between the primary diagnosis or lens status and any of the WDT-IOP parameters was observed.
Table 1.
Baseline characteristics of patients in the trabeculectomy and tube groups

IOP significantly increased from baseline at all measurement time points in both groups [Table 2]. In the Trab group, IOP increased up to 30 minutes, but decreased afterwards. In the Tube group, IOP increased in increments until the last measurement at 60 minutes [Figure 1]. The inter-group gaps in the IOP changes from baseline widened through time; the highest difference between the two groups was observed at 60 minutes after WDT (40.9% in Trab vs. 23% in Tube, P = 0.04; Figure 2 and Table 3).
Table 2.
Comparison of intraocular pressure measurements at baseline and after the water drinking test between the trabeculectomy and tube groups

Figure 1.

Comparison of the mean of the intraocular pressure at baseline and at each time point between the trabeculectomy and tube groups.
Figure 2.

Comparison of the intraocular pressure change from baseline (in percent) at each time point between the trabeculectomy and tube groups.
Table 3.
Comparison of changes in intraocular pressure after the water drinking test between the trabeculectomy and tube groups
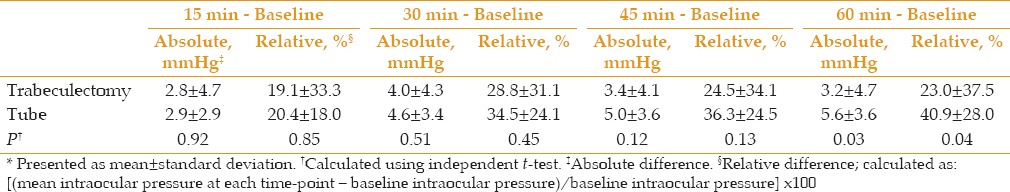
Table 4 presents the comparative results of different WDT-IOP parameters in the two groups. There was no significant difference for all studied parameters between both groups except for the end-pressure difference, which was significantly greater in the Tube group. There was a trend towards a greater frequency of IOP peaks >25 mmHg (23.3% vs. 13.3%) and >30 mmHg (6.7% vs. 3.3%) in the Tube group, when compared to that of the Trab group; however, the difference was not statistically significant [Figure 3].
Table 4.
Comparison of different IOP parameters between the trabeculectomy and tube groups

Figure 3.

Comparison of the categorized IOP peak between the trabeculectomy and tube groups.
DISCUSSION
The purpose of this study was to compare the response to a WDT in eyes that had undergone trabeculectomy or tube surgery. Previous reports have evaluated the WDT response in medically treated glaucoma eyes and after trabeculectomy.[26,27,28,29] In a recent study by Martinez et al,[30] 40 eyes of 34 open-angle glaucoma subjects who had undergone trabeculectomy (n = 20) or tube surgery (n = 20) underwent WDT. The IOP response to the WDT was similar in eyes previously treated with trabeculectomy or tube surgery. They included both eyes of some patient, but in the current study, only one eye of each patient is included. There was an upward trend in IOP up to 30 minutes after WDT for both groups; then, the IOP decreased in the Trab group, while the upward trend continued in the Tube group. The final IOP of the Tube group at 60 minutes was significantly higher than that of the Trab group. A similar trend was observed in the study by Martinez et al[30] in the first 30 minutes after the WDT; after 30 minutes, the IOP decreased in both groups. This difference and lack of increase in IOP in the Tube group after the first 30 minutes could be due to the inclusion of both eyes (having a similar IOP profile) of some patients. Additionally, the patient drank the water over 15 minutes instead of the usual five minutes reported in almost all previous WDT studies. The fluctuation of IOP during the test was also evaluated with no statistically significant differences observed between the Trab (mean of 6 mmHg) and Tube (mean of 6.8 mmHg) groups. This value in the Trab group was higher than previously reported. The IOP fluctuation in the Trab and Tube groups in the study by Martinez et al[30] were 3.95 and 3.6 mmHg, respectively. Medeiros et al[26] reported an IOP change of 1.4 ± 0.4 mmHg in 30 patients with one or two trabeculectomy, which was significantly lower than that of a group of patients with medically-controlled glaucoma (3.7 mmHg, P < 0.0001). Mansouri et al[29] reported the results of 20 subjects treated with latanoprost and compared 20 patients who underwent trabeculectomy and 20 patients who underwent non-penetrating glaucoma surgery. The patients in these surgical groups were not on any glaucoma medications. The WDT-IOP fluctuation was 5.2 mmHg in the latanoprost group, 2.4 mmHg in the trabeculectomy group, and 3.8 mmHg in the non-penetrating glaucoma surgery group (P < 0.05). The latanoprost group had the highest baseline IOP baseline (15.5 mmHg) followed by the non-penetrating glaucoma surgery (13.9 mmHg) and trabeculectomy (10.1 mmHg) groups. More IOP fluctuation was observed in the following groups with a higher baseline IOP: latanoprost (5.2 mmHg), non-penetrating glaucoma surgery (3.8 mmHg), and trabeculectomy (2.4 mmHg). Danesh-Meyer et al[31] compared 30 medically treated glaucoma patients (on different number of different class of anti-glaucoma medications) with 30 trabeculectomy patients who had a controlled IOP without glaucoma medications. The baseline IOP was 10.4 mmHg in the trabeculectomy group and 11.1 mmHg in the group that was treated with medications. WDT-IOP fluctuation was 6.2 mmHg in the medication group and 1.3 mmHg in the trabeculectomy group (P < 0.0001). In all the three aforementioned studies, the trabeculectomy groups had a lower IOP baseline compared to our Trab group and were not on glaucoma medication. A greater degree of IOP fluctuation in our Trab group, compared to the results observed in the aforementioned studies, may be due to a higher baseline IOP and their glaucoma medication. In another study by our group on 203 glaucoma patients, the IOP baseline had an independent association with the peak IOP (r = 0.51, P < 0.001) (unpublished data). The use of glaucoma medication indicates insufficient pressure control following the filtration procedure, suggesting a more limited outflow. In other words, a greater number of medications required to maintain the target IOP may be an indirect measure of an increased resistance of the outflow pathway.
The IOP peak, IOP mean, IOP fluctuation, IOP range, end-pressure difference, and percentage of IOP increase at all measurement time points were greater in the Tube group; however, only the end-pressure difference showed statistical significance. The highest IOP in the Trab was detected at 30 minutes (average of a 28.8% increment in the IOP compared to the IOP baseline) with a subsequent decrease. In the Tube group, the percentage of IOP increase at 30, 45, and 60 minutes were 34.5%, 36.3%, and 40.9%, respectively. The exact mechanism of IOP increase after WDT has not been elucidated. A decrease in outflow secondary to the sympathetic activation after water intake due to the rise of vascular resistance, an increase in choroidal thickness, and blood osmotic changes are the proposed mechanisms.[27,32,33] Irrespective of the mechanism, the ability of the eye to recover from the transient IOP rise after WDT depends on the outflow facility.[20] Brubake[14,20] suggested using the WDT as an indirect measurement test of the outflow facility in order to compare the IOP responses of glaucomatous eyes to different drugs. The different nature of the bleb in the Tube group may explain the higher IOP change during the WDT when compared to that of Trab group. In a trabeculectomy, the diverted aqueous humor to the subconjunctival and sub-Tenon's spaces is absorbed primarily through vascular channels and secondarily through lymphatics and transconjunctival egress (oozing or bleb sweating).[34] The subepithelial connective tissue seems to be less dense and totally avascular in a trabeculectomy augmented with mitomycin C (MMC) compared to those without antimetabolites.[35] All our patients had a MMC trabeculectomy, which results in attenuated scar formation that facilitates aqueous egress. However, the blebs of the tube seemed to be thicker, which may affect the aqueous egress. The bleb surrounding the implant was as thick as the sclera in a case that underwent enucleation 11 months after tube surgery; histopathology showed a thick layer of collagenous tissue.[36] Anterior segment optical coherence tomography of the tube blebs revealed a relatively regular surface, homogenous and hyperreflective bleb wall, and a signal-void, fluid-filled cavity. Minimum bleb thickness in successful tube surgeries is reported to be approximately 0.56 mm by Jung et al.[37] There were no microcysts and no collection of multiloculated fluid, which are common in a trabeculectomy.[38]
IOP peaks have been associated with the progression of glaucoma in the visual fields. In a study, about one-third of patients with progressive visual field loss had IOP peaks during home tonometry compared to 5% of patients with stable visual fields.[39] Yoshikawa et al[40] evaluated several clinical tests for predicting the progression of visual field loss in patients with normal tension glaucoma and concluded that the WDT was the most useful clinical predictor for progression of visual field defects. The Advanced Glaucoma Intervention Study Group suggests maintaining IOP between 10-15 mmHg, with IOP peaks maintained at <18 mmHg to prevent visual field deterioration in patients with moderate or advanced stage glaucoma.[41] The Early Manifest Glaucoma Trial showed that even a 1-mmHg increase in IOP was associated with an 11% increase in the hazard ratio for the progression of glaucoma.[42] A smooth IOP profile in Trab after WDT as an indicator of outflow facility may have a protective effect on a damaged optic nerve compared to Tube.
One limitation of the present study was that we did not monitor the diurnal curve IOP in addition to the WDT. Earlier reports concluded that the WDT is a reliable tool to detect IOP peaks of 24-hour IOP profile.[26,43,44,45,46,47] Additionally, healthy subjects without glaucoma and treated POAG patients do not manifest a repeatable diurnal IOP pattern from day to day.[48,49] This observation limits the clinical value of 1-day diurnal IOP testing in clinical practice. Another limitation was receiving glaucoma medications in our Trab group. Including trabeculectomy patients with controlled IOP without using glaucoma medication may result in a lower WDT-IOP profile, because of lower outflow resistance. Generally, almost all tube patients need medication to maintain their target IOP[16] and recruiting patients with their IOP at target without medication into the tube group may not be practical. The type of glaucoma was not similar in both groups, and may be regarded as a limitation. Although WDT was initially used as a provocative test for detecting glaucoma, it has now been utilized as a fluid stress test that challenges the eyes with a damaged outflow system in any form of glaucoma. Therefore, it does not seem that different glaucoma types have different IOP profiles in the WDT. As mentioned in the Methods section, we used the average of 3 IOP measurements from an airpuff tonometer, which when compared to all available tonometers had only a 0.2-mmHg difference with the Goldmann Applanation Tonometer.[25] However, the ideal study would be one that uses the Goldmann tonometer. The WDT is not without its limitations; it should be avoided in patients with systemic conditions, such as cardiac, renal, prostatic, or respiratory illnesses. However, it can be used for a specific subgroup of glaucoma patients and is cheaper and more feasible than many other methods for evaluating the diurnal IOP profile.
In conclusion, the present study suggests that both the Trab and Tube groups had IOP increases, despite showing seemingly stable IOPs in a standard clinical setting. The WDT-IOP profile was lower in the Trab group than in the Tube group; this difference became significant 60 minutes after drinking water. Further investigation on the 24-hour diurnal curve and WDT after trabeculectomy and tube surgeries, including those who have controlled IOPs without glaucoma medications, may provide more insights into the IOP profile after the filtration surgeries.
Financial Support and Sponsorship
Nil.
Conflicts of Interest
There are no conflicts of interest.
REFERENCES
- 1.Clement CI, Bhartiya S, Shaarawy T. New perspectives on target intraocular pressure. Surv Ophthalmol. 2014;59:615–626. doi: 10.1016/j.survophthal.2014.04.001. [DOI] [PubMed] [Google Scholar]
- 2.Caprioli J, Coleman AL. Intraocular pressure fluctuation a risk factor for visual field progression at low intraocular pressures in the advanced glaucoma intervention study. Ophthalmology. 2008;115:1123–1129. doi: 10.1016/j.ophtha.2007.10.031. [DOI] [PubMed] [Google Scholar]
- 3.Mansouri K, Shaarawy T. Continuous intraocular pressure monitoring with a wireless ocular telemetry sensor: Initial clinical experience in patients with open angle glaucoma. Br J Ophthalmol. 2011;95:627–629. doi: 10.1136/bjo.2010.192922. [DOI] [PubMed] [Google Scholar]
- 4.Drance SM. Arch Ophthalmol. Vol. 70. (Chicago, Ill: 1960): 1963. Diurnal variation of intraocular pressure in treated glaucoma. Significance in patients with chronic simple glaucoma; pp. 302–311. [DOI] [PubMed] [Google Scholar]
- 5.Mosaed S, Liu JH, Weinreb RN. Correlation between office and peak nocturnal intraocular pressures in healthy subjects and glaucoma patients. Am J Ophthalmol. 2005;139:320–324. doi: 10.1016/j.ajo.2004.09.062. [DOI] [PubMed] [Google Scholar]
- 6.Malihi M, Sit AJ. Effect of head and body position on intraocular pressure. Ophthalmology. 2012;119:987–991. doi: 10.1016/j.ophtha.2011.11.024. [DOI] [PubMed] [Google Scholar]
- 7.Mansouri K. The road ahead to continuous 24-hour intraocular pressure monitoring in glaucoma. J Ophthalmic Vis Re s. 2014;9:260–268. [PMC free article] [PubMed] [Google Scholar]
- 8.Mottet B, Chiquet C, Aptel F, Noel C, Gronfier C, Buguet A, et al. 24-hour intraocular pressure of young healthy humans in supine position: Rhythm and reproducibility. Invest Ophthalmol Vis Sci. 2012;53:8186–8191. doi: 10.1167/iovs.12-10877. [DOI] [PubMed] [Google Scholar]
- 9.Liang SY, Lee GA, Shields D. Self-tonometry in glaucoma management-past, present and future. Surv Ophthalmol. 2009;54:450–462. doi: 10.1016/j.survophthal.2009.04.006. [DOI] [PubMed] [Google Scholar]
- 10.Roth JA. Inadequate diagnostic value of the water-drinking test. Br J Ophthalmol. 1974;58:55–61. doi: 10.1136/bjo.58.1.55. [DOI] [PMC free article] [PubMed] [Google Scholar]
- 11.Miller D. The relationship between diurnal tension variation and the water-drinking test. Am J Ophthalmol. 1964;58:243–246. doi: 10.1016/0002-9394(64)91571-5. [DOI] [PubMed] [Google Scholar]
- 12.Frankelson EN. The role of the water test in evaluation of glaucoma control. Can J Ophthalmol. 1974;9:408–410. [PubMed] [Google Scholar]
- 13.Susanna R, Jr, Medeiros FA, Vessani RM, Giampani J, Jr, Borges AS, Jordao ML. Intraocular pressure fluctuations in response to the water-drinking provocative test in patients using latanoprost versus unoprostone. J Ocul Pharmacol Ther. 2004;20:401–410. doi: 10.1089/jop.2004.20.401. [DOI] [PubMed] [Google Scholar]
- 14.Brubaker RF. Targeting outflow facility in glaucoma management. Surv Ophthalmol. 2003;48:S17–20. doi: 10.1016/s0039-6257(03)00003-1. [DOI] [PubMed] [Google Scholar]
- 15.De Moraes CG, Susanna R, Jr, Ritch R. The water drinking test. Am J Ophthalmol. 2011;151:559–560. doi: 10.1016/j.ajo.2010.11.018. [DOI] [PubMed] [Google Scholar]
- 16.Gedde SJ, Schiffman JC, Feuer WJ, Herndon LW, Brandt JD, Budenz DL. Treatment outcomes in the Tube Versus Trabeculectomy (TVT) study after five years of follow-up. Am J Ophthalmol. 2012;153:789–803. doi: 10.1016/j.ajo.2011.10.026. [DOI] [PMC free article] [PubMed] [Google Scholar]
- 17.Joshi AB, Parrish RK, 2nd, Feuer WF. 2002 survey of the American Glaucoma Society: Practice preferences for glaucoma surgery and antifibrotic use. J Glaucom a. 2005;14:172–174. doi: 10.1097/01.ijg.0000151684.12033.4d. [DOI] [PubMed] [Google Scholar]
- 18.Panarelli J. Surgery: Trending towards the tube. Rev of Ophthalmol. 2013:56–60. [Google Scholar]
- 19.Ramulu PY, Corcoran KJ, Corcoran SL, Robin AL. Utilization of various glaucoma surgeries and procedures in Medicare beneficiaries from 1995 to 2004. Ophthalmology. 2007;114:2265–2270. doi: 10.1016/j.ophtha.2007.02.005. [DOI] [PubMed] [Google Scholar]
- 20.Brubaker RF. Importance of outflow facility. Int Glaucoma Rev. 2001;3:5. [Google Scholar]
- 21.Susanna R, Jr, Hatanaka M, Vessani RM, Pinheiro A, Morita C. Correlation of asymmetric glaucomatous visual field damage and water-drinking test response. Invest Ophthalmol Vis Sci. 2006;47:641–644. doi: 10.1167/iovs.04-0268. [DOI] [PubMed] [Google Scholar]
- 22.Spaeth GL, Henderer J, Liu C, Kesen M, Altangerel U, Bayer A, et al. The disc damage likelihood scale: Reproducibility of a new method of estimating the amount of optic nerve damage caused by glaucoma. Trans Am Ophthalmol Soc. 2002;100:181–186. [PMC free article] [PubMed] [Google Scholar]
- 23.Munoz CR, Macias JH, Hartleben C. Reproducibility of the water drinking test. Arch Soc Esp Oftalmol. 2015;90:517–521. doi: 10.1016/j.oftal.2015.03.011. [DOI] [PubMed] [Google Scholar]
- 24.Kumar RS, de Guzman MH, Ong PY, Goldberg I. Does peak intraocular pressure measured by water drinking test reflect peak circadian levels? A pilot study. Clin Exp Ophthalmol. 2008;36:312–315. doi: 10.1111/j.1442-9071.2008.01765.x. [DOI] [PubMed] [Google Scholar]
- 25.Cook JA, Botello AP, Elders A, Fathi Ali A, Azuara-Blanco A, Fraser C, et al. Systematic review of the agreement of tonometers with Goldmann applanation tonometry. Ophthalmology. 2012;119:1552–1557. doi: 10.1016/j.ophtha.2012.02.030. [DOI] [PubMed] [Google Scholar]
- 26.Medeiros FA, Pinheiro A, Moura FC, Leal BC, Susanna R., Jr Intraocular pressure fluctuations in medical versus surgically treated glaucomatous patients. J Ocul Pharmacol Ther. 2002;18:489–498. doi: 10.1089/108076802321021036. [DOI] [PubMed] [Google Scholar]
- 27.Danesh-Meyer HV. The water-drinking test: The elegance of simplicity. Clin Exp Ophthalmol. 2008;36:301–303. doi: 10.1111/j.1442-9071.2008.01782.x. [DOI] [PubMed] [Google Scholar]
- 28.Chen CH, Lu DW, Chang CJ, Chiang CH, Chou PI. The application of water drinking test on the evaluation of trabeculectomy patency. J Ocul Pharmacol Ther. 2000;16:37–42. doi: 10.1089/jop.2000.16.37. [DOI] [PubMed] [Google Scholar]
- 29.Mansouri K, Orguel S, Mermoud A, Haefliger I, Flammer J, Ravinet E, et al. Quality of diurnal intraocular pressure control in primary open-angle patients treated with latanoprost compared with surgically treated glaucoma patients: A prospective trial. Br J Ophthalmol. 2008;92:332–336. doi: 10.1136/bjo.2007.123042. [DOI] [PubMed] [Google Scholar]
- 30.Martinez P, Trubnik V, Leiby BE, Hegarty SE, Razeghinejad R, Savant S, et al. A comparative study of the water drinking test in eyes with open-angle glaucoma and prior trabeculectomy or tube shunt. J Glaucoma. 2017;26:119–125. doi: 10.1097/IJG.0000000000000589. [DOI] [PubMed] [Google Scholar]
- 31.Danesh-Meyer HV, Papchenko T, Tan YW, Gamble GD. Medically controlled glaucoma patients show greater increase in intraocular pressure than surgically controlled patients with the water drinking test. Ophthalmology. 2008;115:1566–1570. doi: 10.1016/j.ophtha.2008.01.023. [DOI] [PubMed] [Google Scholar]
- 32.Kerr NM, Danesh-Meyer HV. Understanding the mechanism of the water drinking test: The role of fluid challenge volume in patients with medically controlled primary open angle glaucoma. Clin Exp Ophthalmol. 2010;38:4–9. doi: 10.1111/j.1442-9071.2009.02183.x. [DOI] [PubMed] [Google Scholar]
- 33.De Moraes CG, Reis AS, Cavalcante AF, Sano ME, Susanna R., Jr Choroidal expansion during the water drinking test. Graefes Arch Clin Exp Ophthalmol. 2009;247:385–389. doi: 10.1007/s00417-008-0969-2. [DOI] [PubMed] [Google Scholar]
- 34.Azuara-Blanco A, Katz LJ. Dysfunctional filtering blebs. Surv Ophthalmol. 1998;43:93–126. doi: 10.1016/s0039-6257(98)00025-3. [DOI] [PubMed] [Google Scholar]
- 35.Filippopoulos T, Hanna E, Chen TC, Grosskreutz CL, Jakobiec FA, Pasquale LR. Correlation of filtration bleb morphology with histology. Int Ophthalmol Clin. 2009;49:71–82. doi: 10.1097/IIO.0b013e3181924d55. [DOI] [PubMed] [Google Scholar]
- 36.Philipp W, Klima G, Miller K. Clinicopathological findings 11 months after implantation of a functioning aqueous-drainage silicone implant. Graefes Arch Clin Exp Ophthalmol. 1990;228:481–486. doi: 10.1007/BF00927266. [DOI] [PubMed] [Google Scholar]
- 37.Jung KI, Lim SA, Park HY, Park CK. Visualization of blebs using anterior-segment optical coherence tomography after glaucoma drainage implant surgery. Ophthalmology. 2013;120:978–983. doi: 10.1016/j.ophtha.2012.10.015. [DOI] [PubMed] [Google Scholar]
- 38.Leung CK, Yick DW, Kwong YY, Li FC, Leung DY, Mohamed S, et al. Analysis of bleb morphology after trabeculectomy with Visante anterior segment optical coherence tomography. Br J Ophthalmol. 2007;91:340–344. doi: 10.1136/bjo.2006.100321. [DOI] [PMC free article] [PubMed] [Google Scholar]
- 39.Zeimer RC, Wilensky JT, Gieser DK, Viana MA. Association between intraocular pressure peaks and progression of visual field loss. Ophthalmology. 1991;98:64–69. doi: 10.1016/s0161-6420(91)32340-6. [DOI] [PubMed] [Google Scholar]
- 40.Yoshikawa K, Inoue T, Inoue Y. Normal tension glaucoma: The value of predictive tests. Acta Ophthalmol (Copenh) 1993;71:463–470. doi: 10.1111/j.1755-3768.1993.tb04619.x. [DOI] [PubMed] [Google Scholar]
- 41.The Advanced Glaucoma Intervention Study (AGIS). 7. The relationship between control of intraocular pressure and visual field deterioration. The AGIS Investigators. Am J Ophthalmol. 2000;130:429–440. doi: 10.1016/s0002-9394(00)00538-9. [DOI] [PubMed] [Google Scholar]
- 42.Bengtsson B, Leske MC, Hyman L, Heijl A. Fluctuation of intraocular pressure and glaucoma progression in the early manifest glaucoma trial. Ophthalmology. 2007;114:205–209. doi: 10.1016/j.ophtha.2006.07.060. [DOI] [PubMed] [Google Scholar]
- 43.Rasmussen KE, Jorgensen HA. Diagnostic value of the water-drinking test in early detection of simple glaucoma. Acta Ophthalmol (Copenh) 1976;54:160–166. doi: 10.1111/j.1755-3768.1976.tb00427.x. [DOI] [PubMed] [Google Scholar]
- 44.Winder AF, Siddiqui AA, Donovan HC. Ocular hypertension and systemic responses to the water-drinking test. Br J Ophthalmol. 1978;62:414–419. doi: 10.1136/bjo.62.6.414. [DOI] [PMC free article] [PubMed] [Google Scholar]
- 45.Susanna R, Jr, Sheu WP. Comparison of latanoprost with fixed-combination dorzolamide and timolol in adult patients with elevated intraocular pressure: An eight-week, randomized, open-label, parallel-group, multicenter study in Latin America. Clin Ther. 2004;26:755–768. doi: 10.1016/s0149-2918(04)90075-6. [DOI] [PubMed] [Google Scholar]
- 46.Kronfeld PC. Water drinking and outflow facility. Invest Ophthalmol. 1975;14:49–52. [PubMed] [Google Scholar]
- 47.Vucicevic ZM, Scheie HG, Berry A, Yaros M, Frauenhoffer C. The importance and accuracy of the water drinking test and tonography. Ann Ophthalmol. 1975;7:39–45. [PubMed] [Google Scholar]
- 48.Realini T, Weinreb RN, Wisniewski SR. Diurnal intraocular pressure patterns are not repeatable in the short term in healthy individuals. Ophthalmology. 2010;117:1700–1704. doi: 10.1016/j.ophtha.2010.01.044. [DOI] [PMC free article] [PubMed] [Google Scholar]
- 49.Realini T, Weinreb RN, Wisniewski S. Short-term repeatability of diurnal intraocular pressure patterns in glaucomatous individuals. Ophthalmology. 2011;118:47–51. doi: 10.1016/j.ophtha.2010.04.027. [DOI] [PubMed] [Google Scholar]