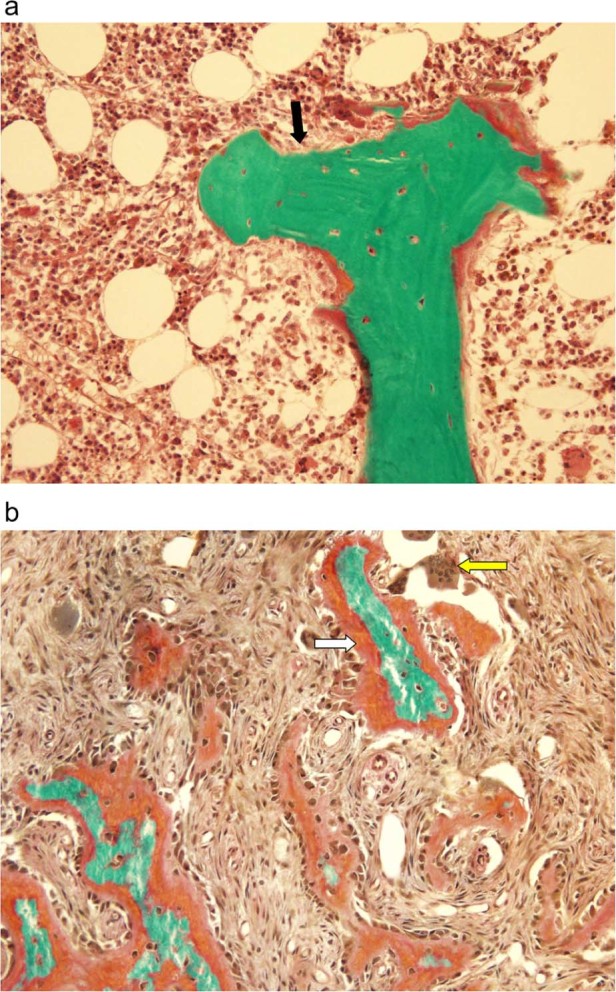
Figure 1.

a: Adynamic bone disease. Depicts a classic bone biopsy featuring minimal osteoid (black arrow) and nearly no activity of osteoblasts or osteoclasts.
Image courtesy of Avudai Maran, PhD and Bart Clarke, MD – Biomaterials and Histomorphometry Core Lab, Mayo Clinic, Rochester, MN. b: Osteitis fibrosa cystica. Characterized by thick osteoid production (white arrow) with increased osteoclast activity (yellow arrow). Image courtesy of Avudai Maran, PhD and Bart Clarke, MD – Biomaterials and Histomorphometry Core Lab, Mayo Clinic, Rochester, MN. (For interpretation of the references to color in this figure legend, the reader is referred to the Web version of this article.)
