
Figure 2.
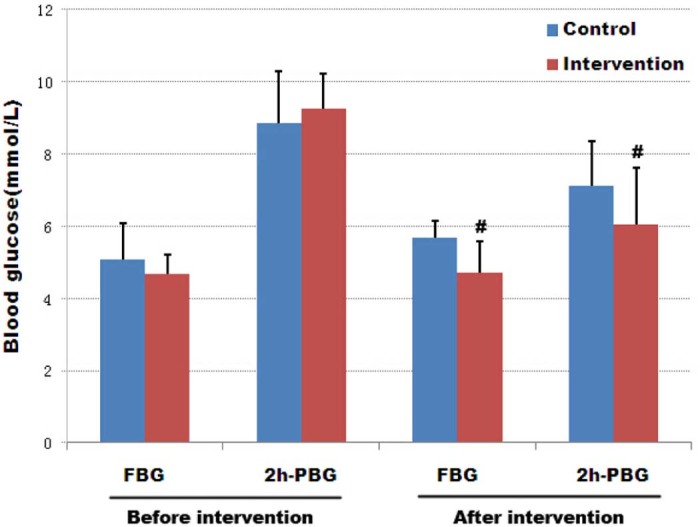
Effect of a macro-nutrient preload on blood glucose before and after intervention in GDM patients. The graph depicts the mean fasting blood glucose (FBG) and the mean 2 h post-prandial blood glucose levels (mmol/L) before and after macro-nutrient preload treatment. Both control and intervention groups include 33 cases; error bars indicate one SEM, #P < 0.01.