
Figure 2. Gene signature performance on IPD, controls, and other NDDs.
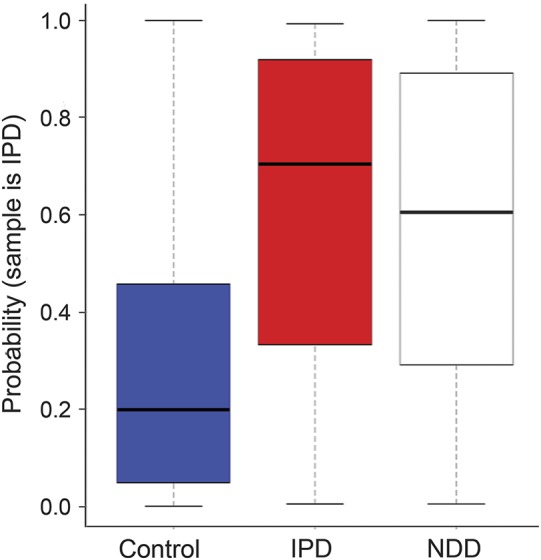
The y-axis is the probability that a sample is classified as PD. Each boxplot summarizes the distribution of probabilities for samples from each cohort. The 2 left boxplots show the results for the IPD (n = 40) and control (n = 30) samples in the test set. The right boxplot shows the results for new participants with other neurodegenerative diseases (n = 48) consisting of HD (n = 27), MSA (n = 9), PSP (n = 8), CBD (n = 2), and PDD (n = 2). Values of p are as follows: IPD vs control, p = 0.0004; NDD vs control, p = 0.0005; and IPD vs NDD, p = 0.58. CBD = corticobasal degeneration; HD = Huntington disease; IPD = idiopathic Parkinson disease; MSA = multiple system atrophy; NDD = neurodegenerative diseases; PDD = Parkinson disease dementia; PSP = progressive supranuclear palsy.