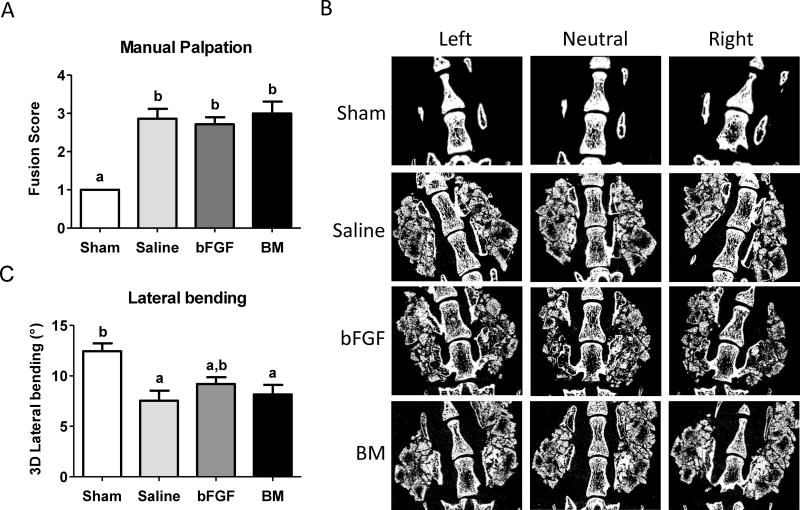
Figure 4.
Analysis for spinal fusion. (A) Fusion score generated from manual palpation for each group; saline-, basic fibroblast growth factor (bFGF)-, and bone marrow (BM)-soaked grafts, after 8 weeks of implantation. Different letters represent statistical significance. Error bars represent standard error of the mean (n=7, p<0.05). (B) Micro-computed tomography (µCT) of sham, saline-soaked, bFGF-soaked and BM-soaked biomineralized grafts undergoing lateral bending measurements. Representative images at different positions during measurements for various groups after 8 weeks post-implantation. (C) Three-dimensional (3-D) lateral bending angles of spine with saline-, bFGF-, and BM-soaked grafts compared to sham surgery. Different letters represent statistical significances with “a” statistically significant to “b”. Error bars indicate standard error of the mean (n=7, p<0.01).

