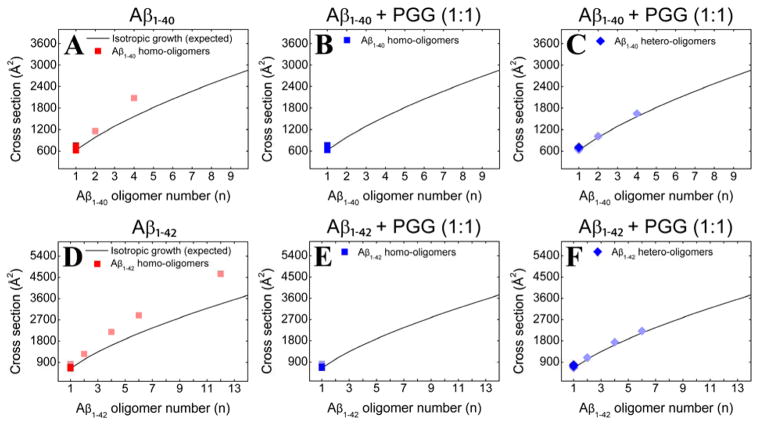
Figure 2.
Oligomer growth curves of (A) Aβ1-40 homo-oligomers, (B, C) Aβ1-40 homo- and hetero-oligomers, respectively, formed in the 1:1 mixture of Aβ1-40 and PGG, (D) Aβ1-42 homo-oligomers, (E, F) Aβ1-42 homo- and hetero-oligomers formed in the 1:1 mixture of Aβ1-42 and PGG. The cross section data are colored according to the intensities of the corresponding mass spectral peaks (darker or lighter colors indicate more or less intense features, respectively).

