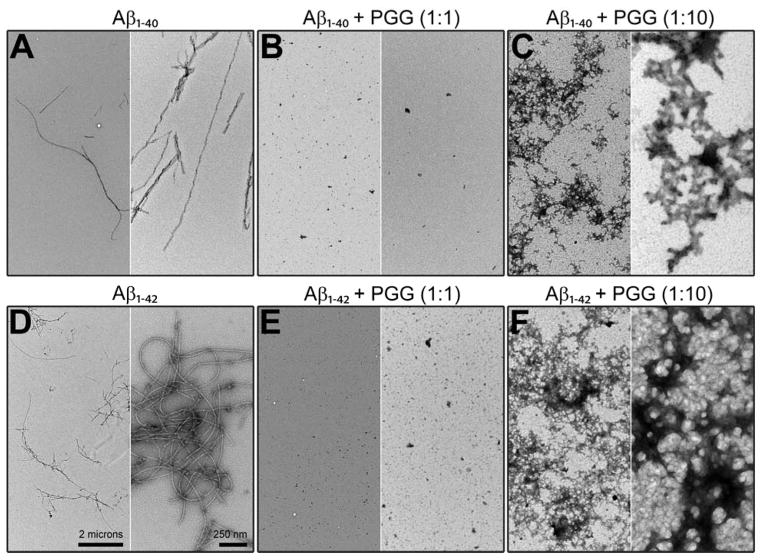
Figure 3.
Representative TEM images of (A) Aβ1-40 alone, (B, C) Aβ1-40 incubated with PGG at 1:1 and 1:10, (D) Aβ1-42 alone, (E, F) Aβ1-42 incubated with PGG at 1:1 and 1:10 molar ratios. The two scale bars shown in panel D apply to all panels. Samples were incubated for two days before the analyses.

