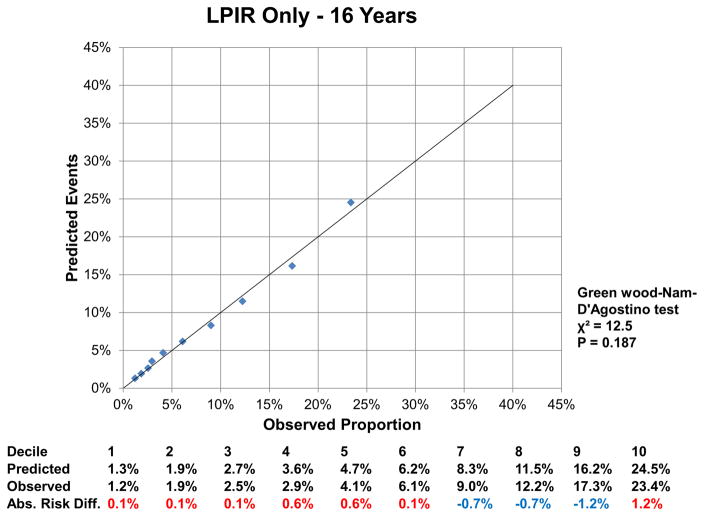
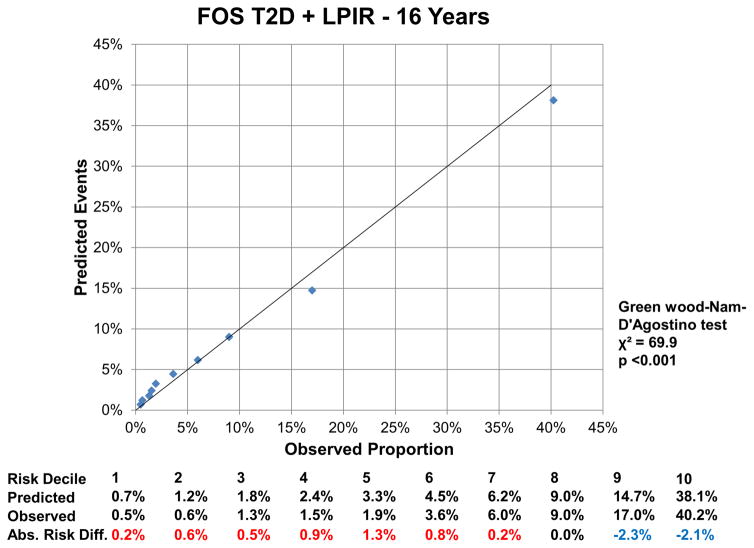
Figure 6.
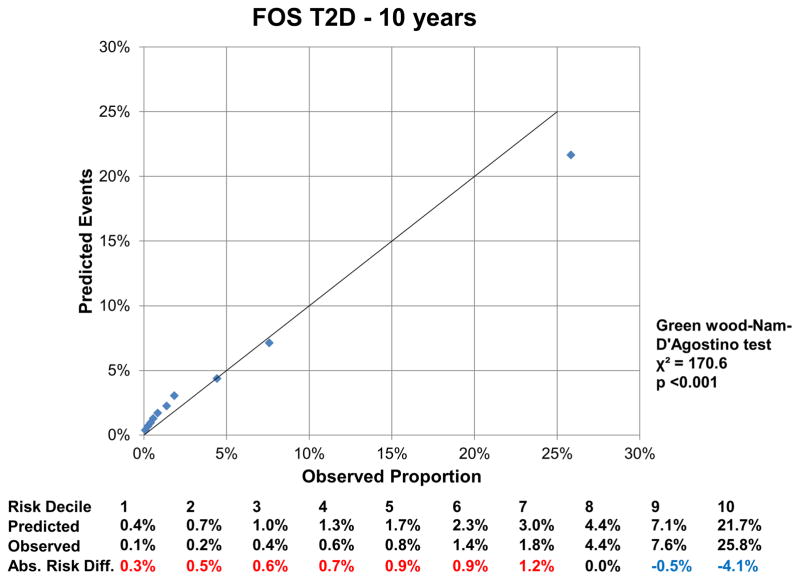
6 A: Calibration Plot Framingham Offspring T2D at 10 Years
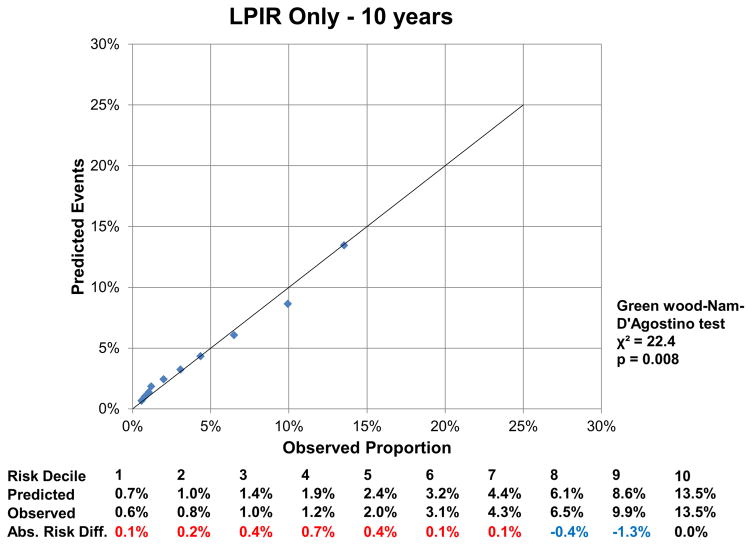
6 B: Calibration LPIR Only at 10 Years
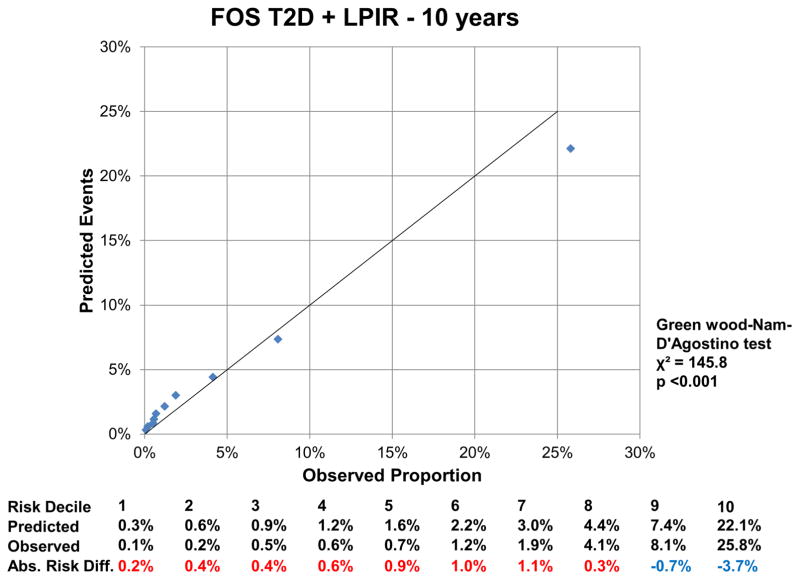
6 C: Calibration Plot Framingham Offspring T2D + LPIR at 10 Years
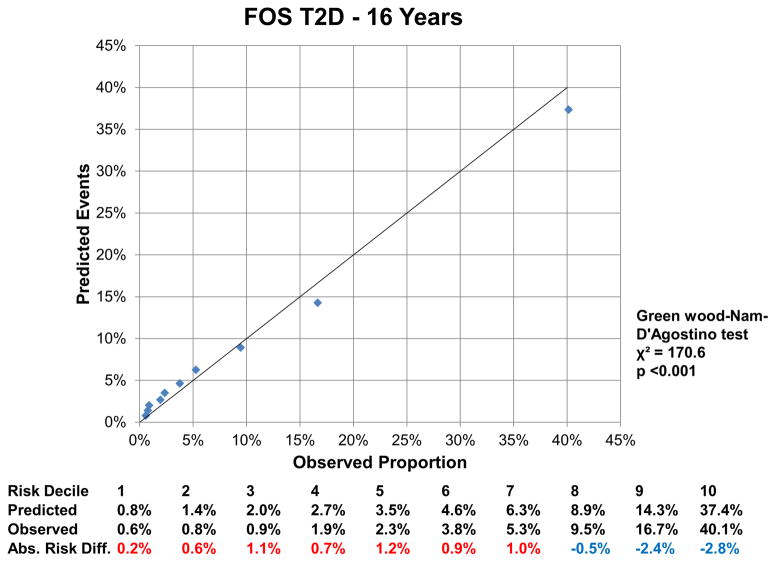
6 D: Calibration Plot Framingham Offspring T2D at 16 Years
6 E: Calibration LPIR Only at 16 Years
6 F: Calibration Plot Framingham Offspring T2D + LPIR at 16 Years
Variables in the Framingham Offspring model, age, family history of T2D, body mass index, systolic blood pressure, anti-hypertensive medication, HDL, triglycerides and HbA1c. For calibration analysis Greenwood-Nam-D’Agostino test was applied, where a P value <0.05 indicate a non calibrated model. Tables below graphs displaying the predicted risk by corresponding model, the observed risk and the absolute difference of the former minus the last. Red colour indicates overestimation and blue one underestimation of the prediction model.

