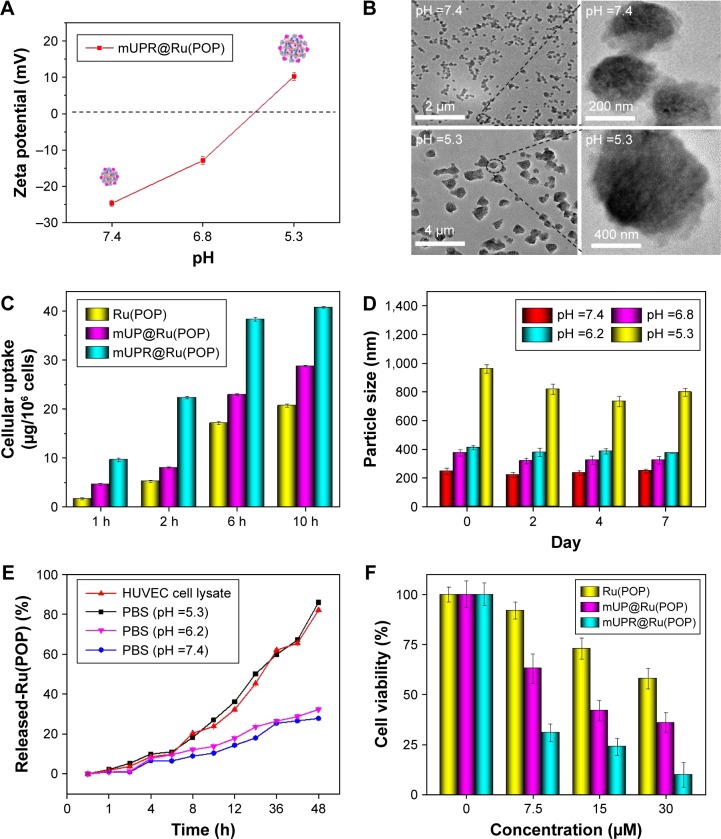
Figure 2.
(A) Zeta potential of mUPR@Ru(POP) at different pH values. (B) TEM images of mUPR@Ru(POP) at pH 7.4 and 5.3. (C) Quantitative cellular uptake of Ru(POP), mUP@Ru(POP), and mUPR@Ru(POP) in HUVECs (2×10⁵ cells/mL). HUVECs were treated with Ru(POP) (10 μg/mL), mUP@Ru(POP) (10 μg/mL), and mUPR@Ru(POP) (10 μg/mL) for different periods of time. The concentrations of Ru(POP) were determined by ICP-MS. (D) Change in the particle size of mUPR@Ru(POP) with pH value. (E) In vitro drug release of Ru(POP) from mUPR@Ru(POP) in different solution. (F) The cell viability of HUVECs treated with different concentrations of Ru(POP), mUP@ Ru(POP), and mUPR@Ru(POP) for 72 h. Each value represents mean ± SD (n=3).
Abbreviations: HUVEC, human umbilical vein endothelial cell; ICP-MS, inductively coupled plasma mass spectrometry; mPEG, methoxy polyethylene glycol; mUP, mPEG-UL polysaccharide-NIPAM; mUPR, mPEG-UL polysaccharide-NIPAM-RGD; NIPAM, N-isopropyl acrylamide; RGD, Arg–Gly–Asp; Ru(POP), [Ru(phen)2p-MOPIP](PF6)2·2H2O; TEM, transmission electron microscopy; UL, Ulva lactuca.

