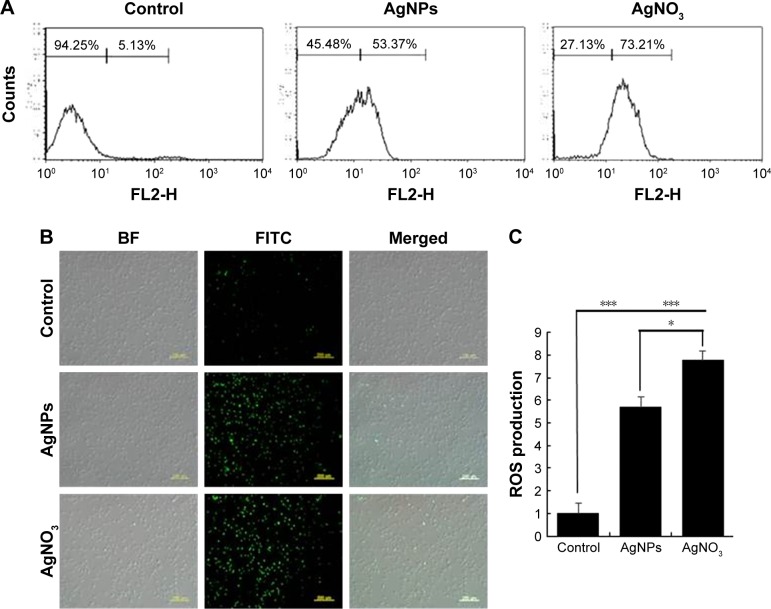
Figure 3.
Effect of AgNPs on ROS generation.
Notes: (A) F9 cells were treated with or without 12.5 μg/mL of AgNPs or 6.125 μg/mL of AgNO3 for 24 h, and ROS generation was measured using flow cytometry. (B) Treated cells were measured for DCFH-DA-FITC by fluorescence microscopy analysis. Scale bar =200 μm. (C) The bar graph indicates the ratio between control and treated samples. The results are expressed as the mean ± standard deviation of three independent experiments. There was a significant difference observed in the ROS generation in the AgNPs- or AgNO3-treated cells compared to that of the untreated cells using Student’s t-test (*P<0.5, ***P<0.01).
Abbreviations: AgNPs, silver nanoparticles; ROS, reactive oxygen species; DCFH-DA, 2′,7′-dichlorodihydrofluorescein diacetate; BF, bright field; FITC, fluorescein isothiocyanate.

