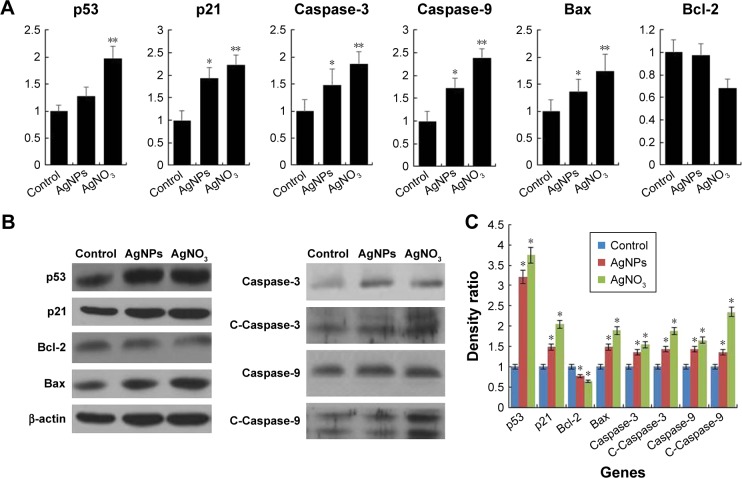
Figure 6.
Effect of AgNPs on pro- and antiapoptotic gene expression.
Notes: (A) F9 cells were treated with or without 12.5 μg/mL of AgNPs or 6.125 μM of AgNO3 for 24 h, and the relative mRNA expression was analyzed by RT-qPCR. (B) Protein expression was analyzed using western blot. (C) The bar graph indicates the signal intensity ratio between control and treated groups. The results are expressed as the mean ± standard deviation of three separate experiments. The treated groups showed statistically significant differences from the control group determined using Student’s t-test (*P<0.05 and **P<0.1).
Abbreviations: AgNPs, silver nanoparticles; RT-qPCR, reverse transcription-quantitative polymerase chain reaction.

