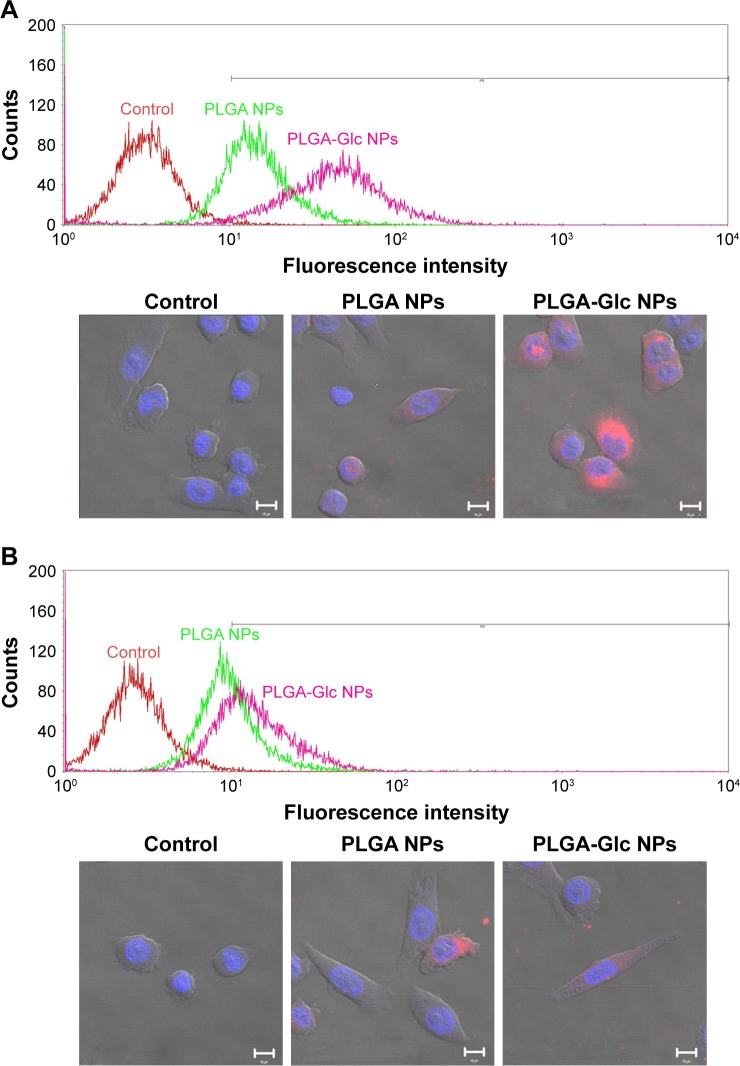
Figure 7.
Cellular uptake and distribution of developed NPs in Hep-2 cells.
Notes: Cellular uptake efficiency and cellular localization of DiI-loaded NPs were investigated by flow cytometry and CLSM, respectively. DiI-loaded NPs were incubated for 4 hours in cell culture media with (A) no D-(+)-glucose and (B) high D-(+)-glucose. The concentration of DiI was 1 μg/mL. Fluorescence intensity of DiI-loaded NP-treated groups (red: control, green: PLGA NPs, and pink: PLGA-Glc NPs) was measured by flow cytometry (upper panel). In CLSM images (lower panel), red and blue colors indicate DiI and 4′,6-diamidino-2-phenylindole staining, respectively. The length of the scale bar in CLSM image is 10 μm.
Abbreviations: CLSM, confocal laser scanning microscopy; DiI, 1,1′-dioctadecyl-3,3,3′,3′-tetramethylindocarbocyanine perchlorate; Glc, star glucose; NPs, nanoparticles; PLGA, poly((D,L)lactic-glycolic)acid.

