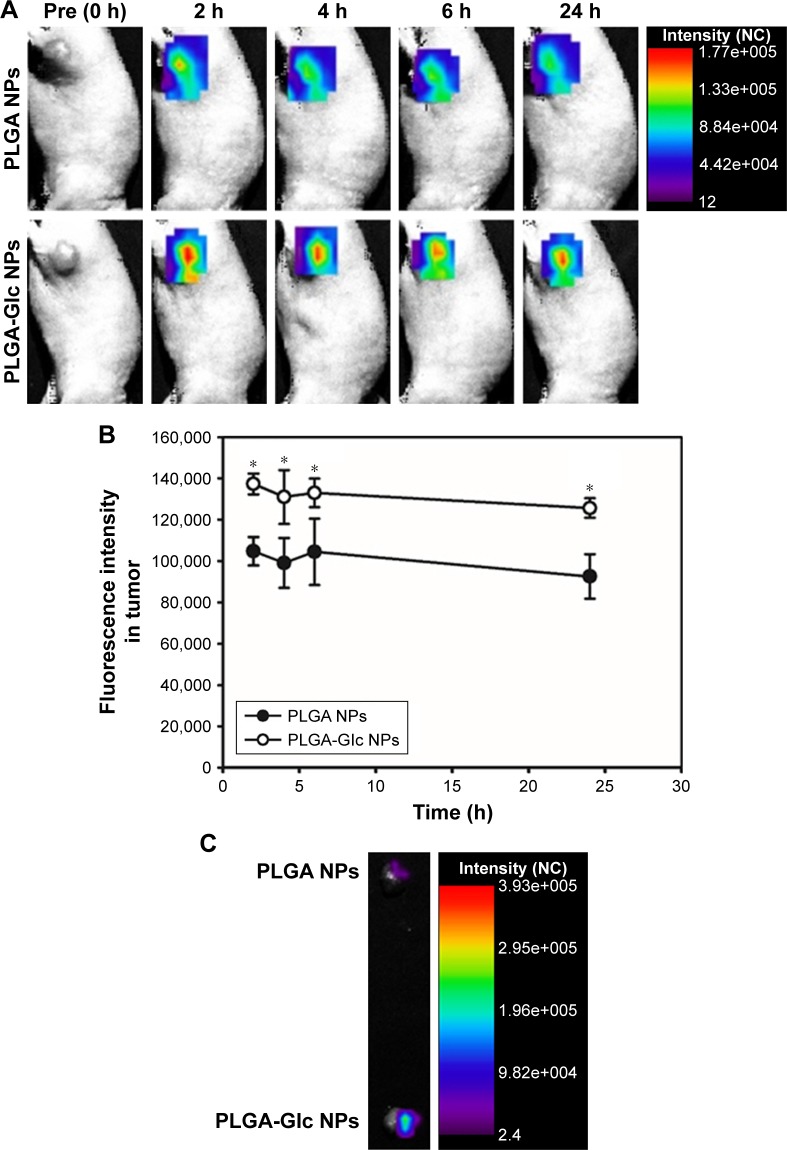
Figure 8.
In vivo near-infrared fluorescence imaging in Hep-2 tumor-xenografted mouse model.
Notes: Hydrophobic Cy5.5-loaded NPs were injected intravenously into the mouse. (A) Images of tumor region (0, 2, 4, 6, and 24 hours postinjection) are presented. (B) The profiles of fluorescence intensity in the tumor region are presented. Each point indicates the mean ± SD (n=3). *p<0.05, compared with PLGA NPs group. (C) Ex vivo image of tumor (24 hours postinjection) of both groups is shown.
Abbreviations: NC, normalized counts; NPs, nanoparticles; PLGA, poly((D,L)lactic-glycolic)acid.

