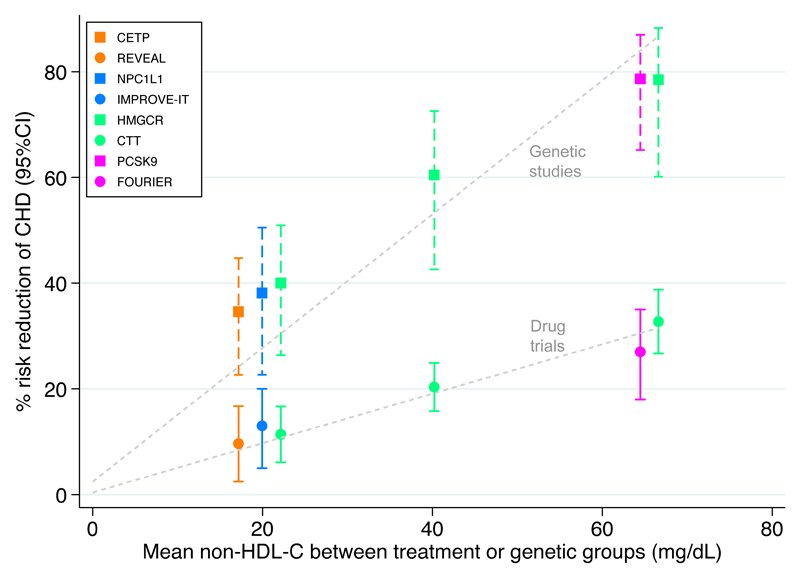
Figure 1. Non-HDL-cholesterol levels and risk of coronary heart disease in drug trials and genetic studies.
Comparison of the effects of drugs (circles) and corresponding genetic proxies (squares) on the risk of coronary heart disease (CHD) according to their treatment and genetic effects on non-HDL-cholesterol (HDL-C) levels. The three values from the Cholesterol Treatment Trialists’ collaboration (CTT; green circles) are derived, from left to right, from: five trials of more versus less statin; 17 trials of statin versus placebo with <50 mg/dl average difference in non-HDL-C levels; and four trials of statin versus placebo with >50 mg/dl average difference in non-HDL-C levels. These data and the data from REVEAL were obtained from2; estimates obtained using PlotDigitizer (http://plotdigitizer.sourceforge.net/). Data on genetic variants were obtained from ref. 6 and scaled to match the corresponding differences in non-HDL-C achieved from drug trials, using apolipoprotein B as a proxy for non-HDL-C. CHD end points: coronary death or myocardial infarction (MI) in REVEAL and CCT; MI in IMPROVE-IT and FOURIER; and MI, coronary revascularization, stroke, or coronary death in Ference et al.6. CETP, cholesteryl ester transfer protein; HMGCR, 3-hydroxy-3-methylglutaryl-CoA reductase; NPC1L1, Niemann–Pick C1-like protein 1.

