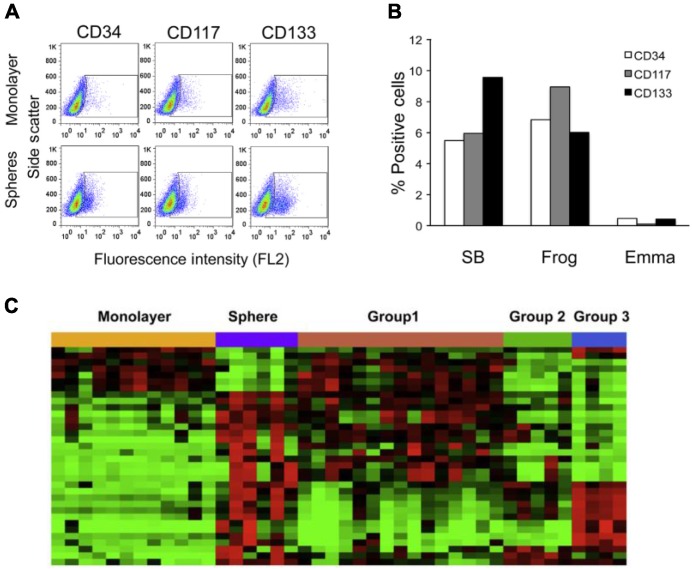
Figure 4.
Sphere cells serve as an in vitro model for HSA progenitor cells and express markers for endothelial and hematopoietic progenitors. (A) Flow cytometric analysis of expression of CD34, CD117, and CD133; (B) Graphical representation of the percentage of positive cells for each marker in the monolayer cells subtracted from the percentage of positive cells detected in the corresponding sphere cells. Results show a relative enrichment of the markers in sphere cells; (C) Heat map of 34 gene expression patterns significant in both the comparisons between the genes differently expressed in intact tumors and the genes differently expressed by spheres. For (C), each data set was independently mean centered. Reproduced with permission from [20].

