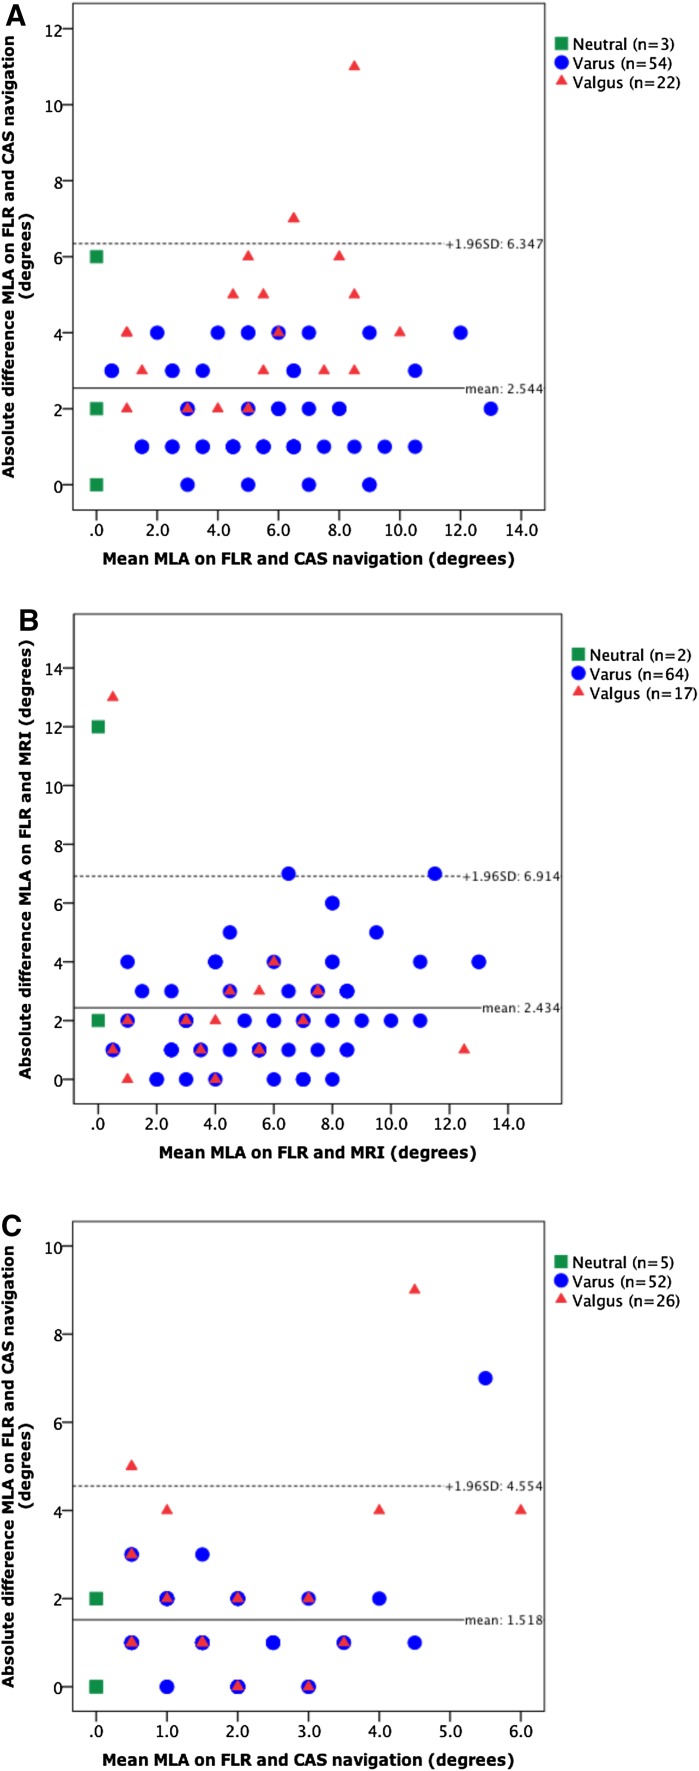
Fig. 2.
Plots with agreement of MLA measurements. Solid black lines give the mean difference in measurements and the dotted lines give the limit of agreement (mean difference ±1.96 × SD of the differences). MLA mechanical leg axis, FLR full-length radiograph, CAS computer-assisted surgery, MRI magnetic resonance imaging. a MLA on FLR versus CAS navigation preoperatively. b MLA on FLR versus MRI preoperatively. c MLA on FLR versus CAS navigation post-operatively

