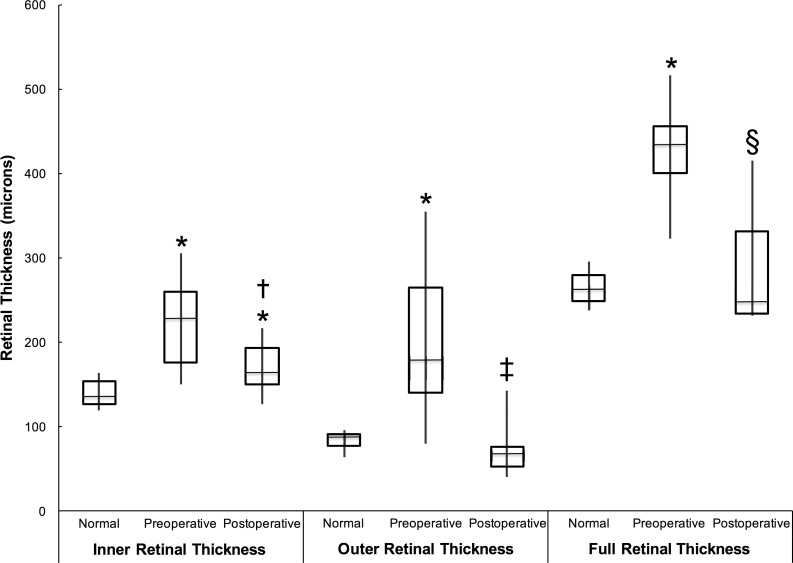
Figure 5.
This box-and-whisker plot illustrates the changes in retinal thicknesses for the inner, outer, and full retinal thicknesses overlying the SMH before and after surgery. Retinal measurements in the normal, contralateral eye are also provided for comparison and control. The significance of individual comparisons is shown by the symbols: *significant difference with P < 0.028 compared with the respective normal measurement; †significant difference with P < 0.028 compared with the IRT before surgery; ‡significant difference with P < 0.043 compared with the ORT before surgery; §significant difference with P < 0.018 compared with the FRT before surgery.

