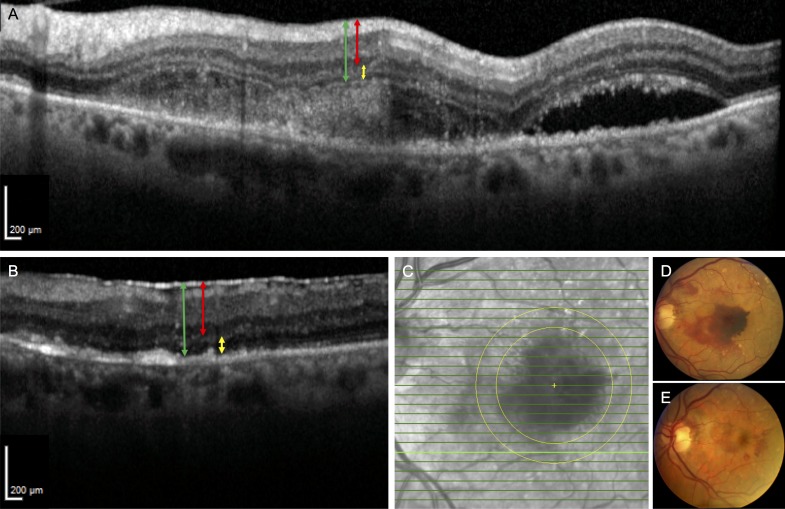
Figure 6.
Fundus photographs and representative SD-OCT images of patient 4. (A) Wide-field, high-magnification SD-OCT of SMH involving the fovea prior to surgery shows thickened inner and outer retina. (B) Postoperative month 13 SD-OCT scan of the same area captured in previous panel after subretinal tPA displacement. The red line represents the measurement made for the IRT, the yellow line represents the ORT, and the green line represents the FRT. (C) Infrared fundus image of the macula with the bolded green line representing the location within the concentric circles where the measurements were made before and after subretinal tPA displacement of SMH. (D) Preoperative fundus photograph showing the SMH. (E) Postoperative month 3 fundus photograph of the nearly resolved SMH in previous panel.

