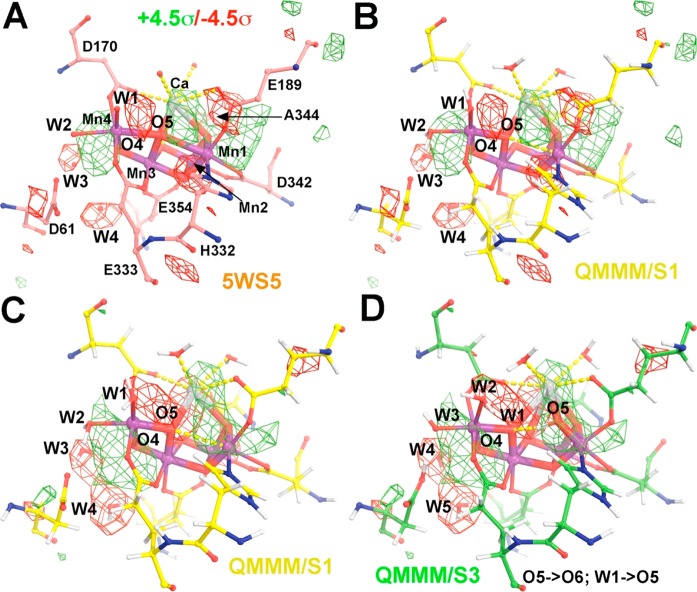
Figure 2.
Observed difference Fourier maps between the Fobs(5WS6/S3) – Fobs(5WS5/S1) XFEL data sets superimposed on the experimental S1 model (A) and on the theoretical QM/MM S1 model (B). (C,D) QM/MM-simulated difference Fourier maps between the Fsimulated(S3) – Fobs(5WS5/S1) pair, contoured at +4.5σ (green) and −4.5σ (red), superimposed onto the 5WS5 model (A, salmon), QM/MM S1 model (B,C, yellow), and QM/MM S3 model (D, green). When compared to the S1 state, the S3 model involves the following displacements: O5 → O6, W1 → O5, W2 → W1, W3 → W2, and W4 → W3. See Figures S5–S7 for additional stereodiagram views with numbering according to the PDB file reported for 5WS5.

