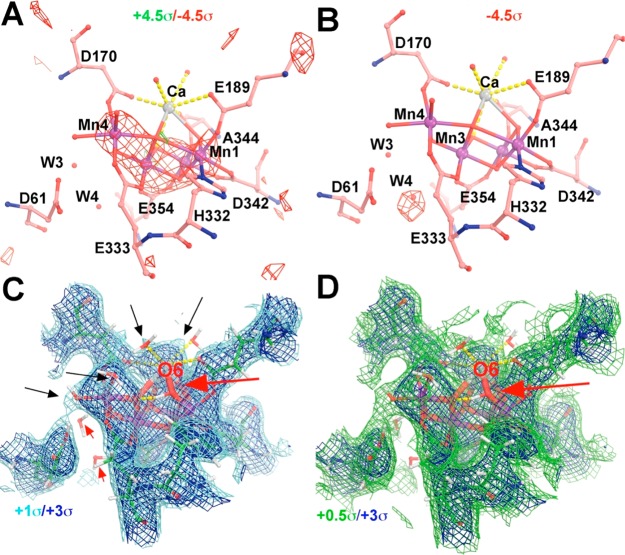
Figure 3.
Assessment of the 5WS6 S3 model using difference Fourier methods: (A) Fcalc(5WS6/S3) – Fcalc(5WS5/S1) or (B) Fcalc(5WS6/S3) – Fobs(5WS5/S1) maps contoured at +4.5σ (green) and −4.5σ (red) and σA-weighted 2Fobs – Fcalc map contoured at +1.0σ (cyan)/+3.0σ (blue) (C) and at +0.5σ (green)/+3.0σ (blue) (D). At the +1.0σ level (C), water ligands to the Ca and Mn centers (marked by black arrows) begin to emerge, but not O6 (red arrow) or W3 and W4 (small red arrows). There is no electron density visible for O6 at any contour level.

