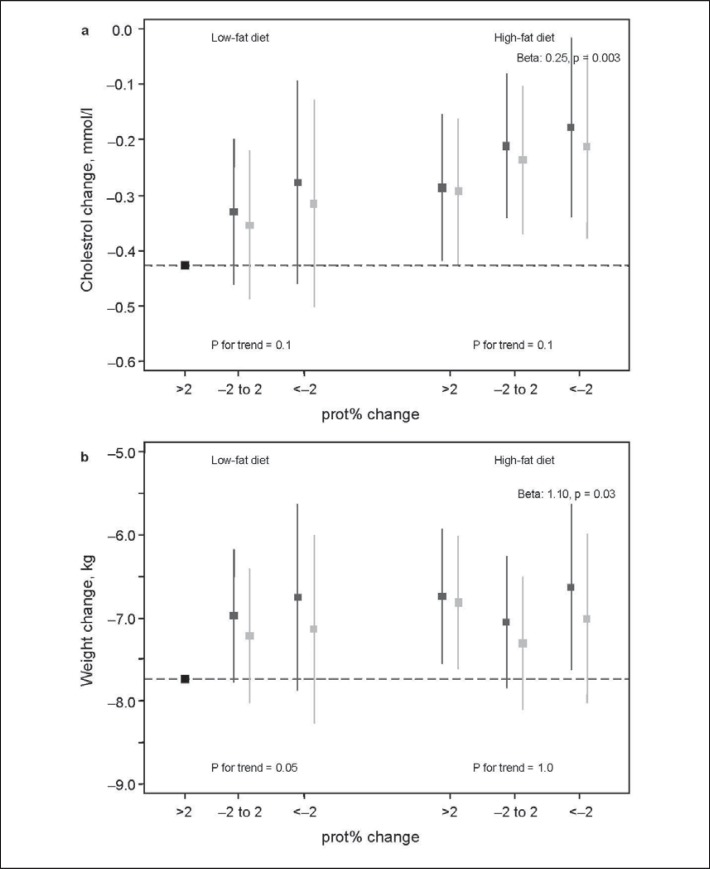
Fig. 2.
Additive effect between randomised fat group and three groups of change in energy% intake from protein (prot%), in relation to change in weight and cholesterol. The y-axis displays the mean change of weight or cholesterol in each group, and confidence intervals (CI) correspond to CI:s derived from linear regression using the largest group (low-fat, >2 units increased prot% intake) as the reference. Beta is shown for the group with the largest deviance from the reference. ▦ basic model, ▨ additional adjustment for change in energy intake.

