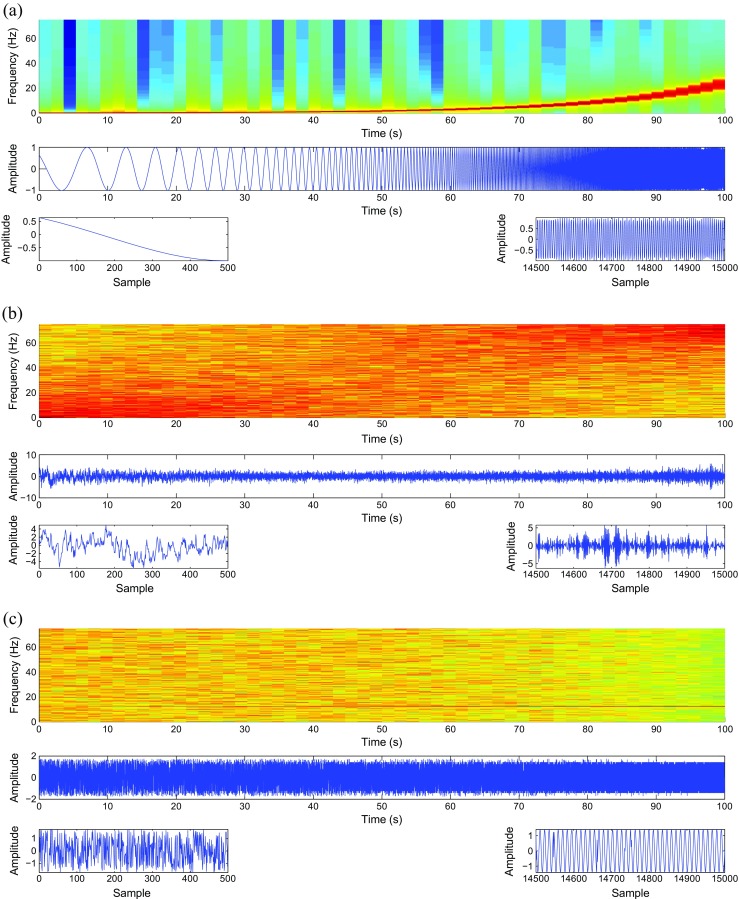
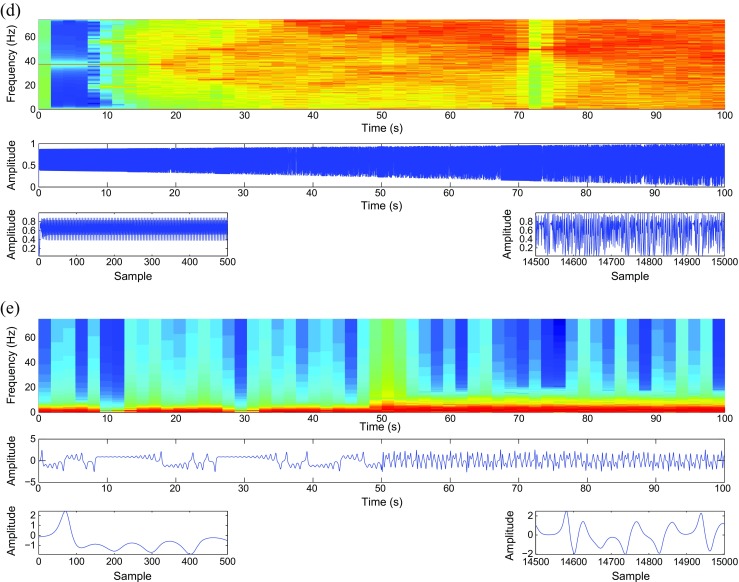
Fig. 1.


Spectrograms, time plots, and zoom views on the first and last time intervals of the synthetic signals used in this study. a Chirp signal with constant amplitude. b AR(1) process with variable parameter ρ. c MIX process evolving from randomness to periodic oscillations. d Logistic map signal. e Lorenz system with two different non-linear dynamics. Red corresponds to high power and blue corresponds to low power (color figure online)
