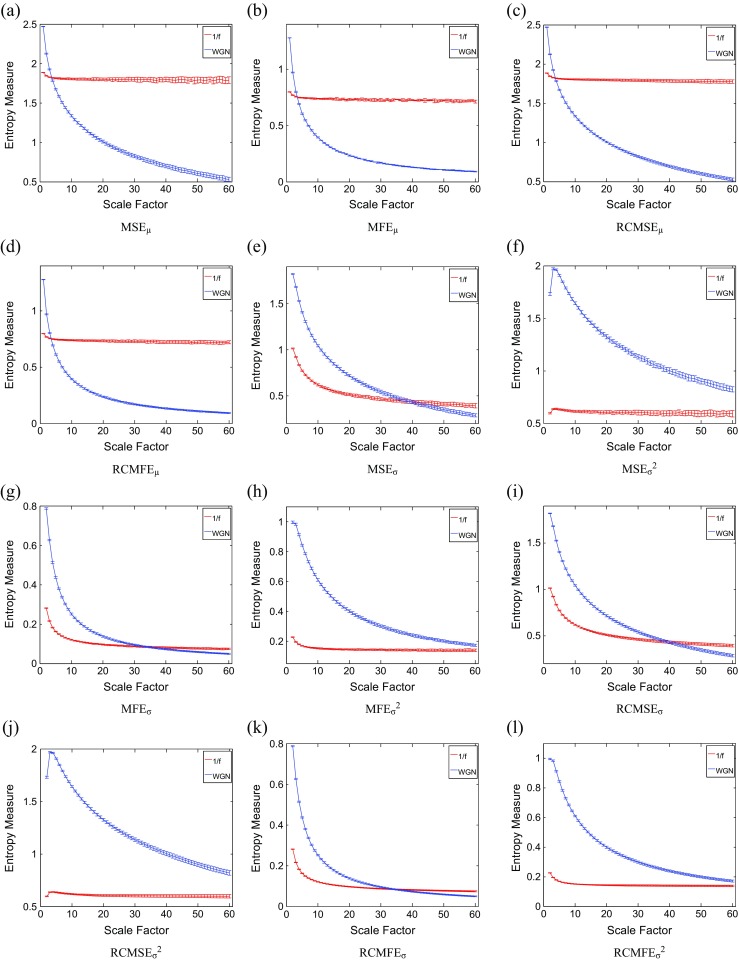
Fig. 2.

Mean value and SD of results of the a MSEμ, b MFEμ, c RCMSEμ, d RCMFEμ, e MSEσ, f MSEσ 2, g MFEσ, h MFEσ 2, i RCMSEσ, j RCMSEσ 2, k RCMFEσ, and l RCMFEσ 2 computed from 40 different 1/f noise test signals. Red and blue indicate 1/f noise and WGN results, respectively
