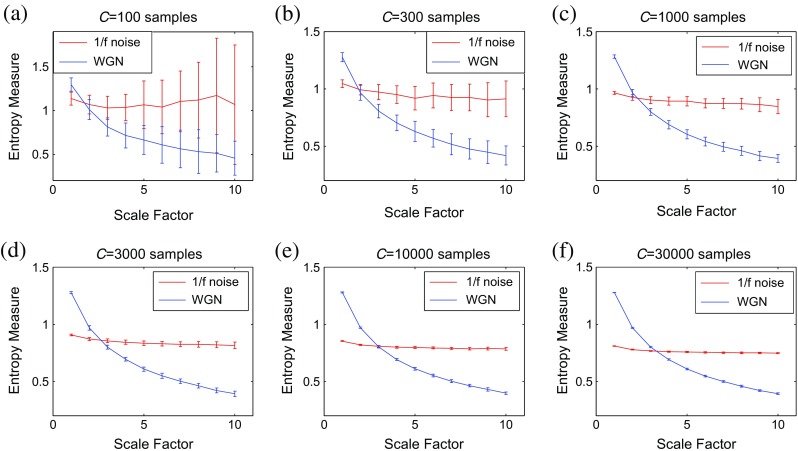
Fig. 5.

MFEμ as a function of data length C, a C = 100, b C = 300, c C = 1000, d C = 3000, e C = 10,000, and f C = 30,000 computed from 40 different WGN and 1/f noise signals. Red and blue demonstrate 1/f noise and WGN results, respectively (color figure online)
