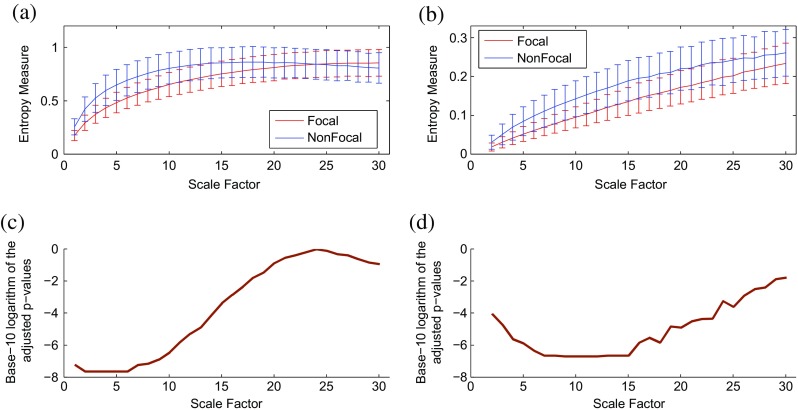
Fig. 9.

Plots illustrating the mean ± SD (with error bars) of the a RCMFEμ and b RCMFEσ values computed from focal and non-focal EEG signals. Base-10 logarithm of the FDR-adjusted p values for the differences in c RCMFEμ and d RCMFEσ at each temporal scale between focal and non-focal signals
