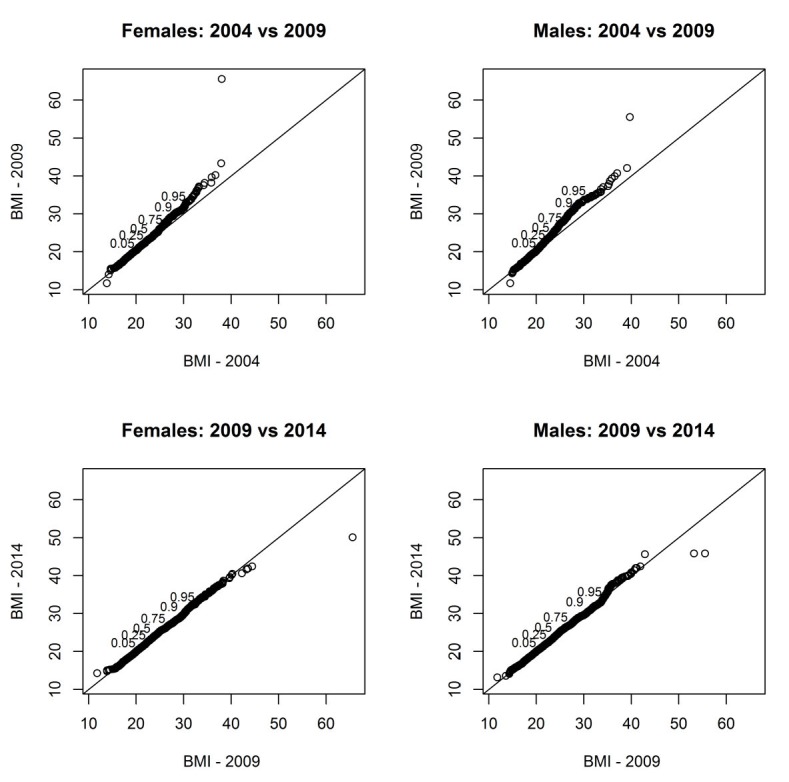
Fig. 1.

Quantile to quantile plots of observed BMI in adolescent males and females in the period 2004-2014 (pairwise comparisons). The numbers in the plots indicate the ordinate position of the corresponding quantile of the distribution plotted on the ordinate axis, e.g., in the first plot 0.5 is plotted on the ordinate where the median of the distribution of BMI for year 2004 is 21.3.
