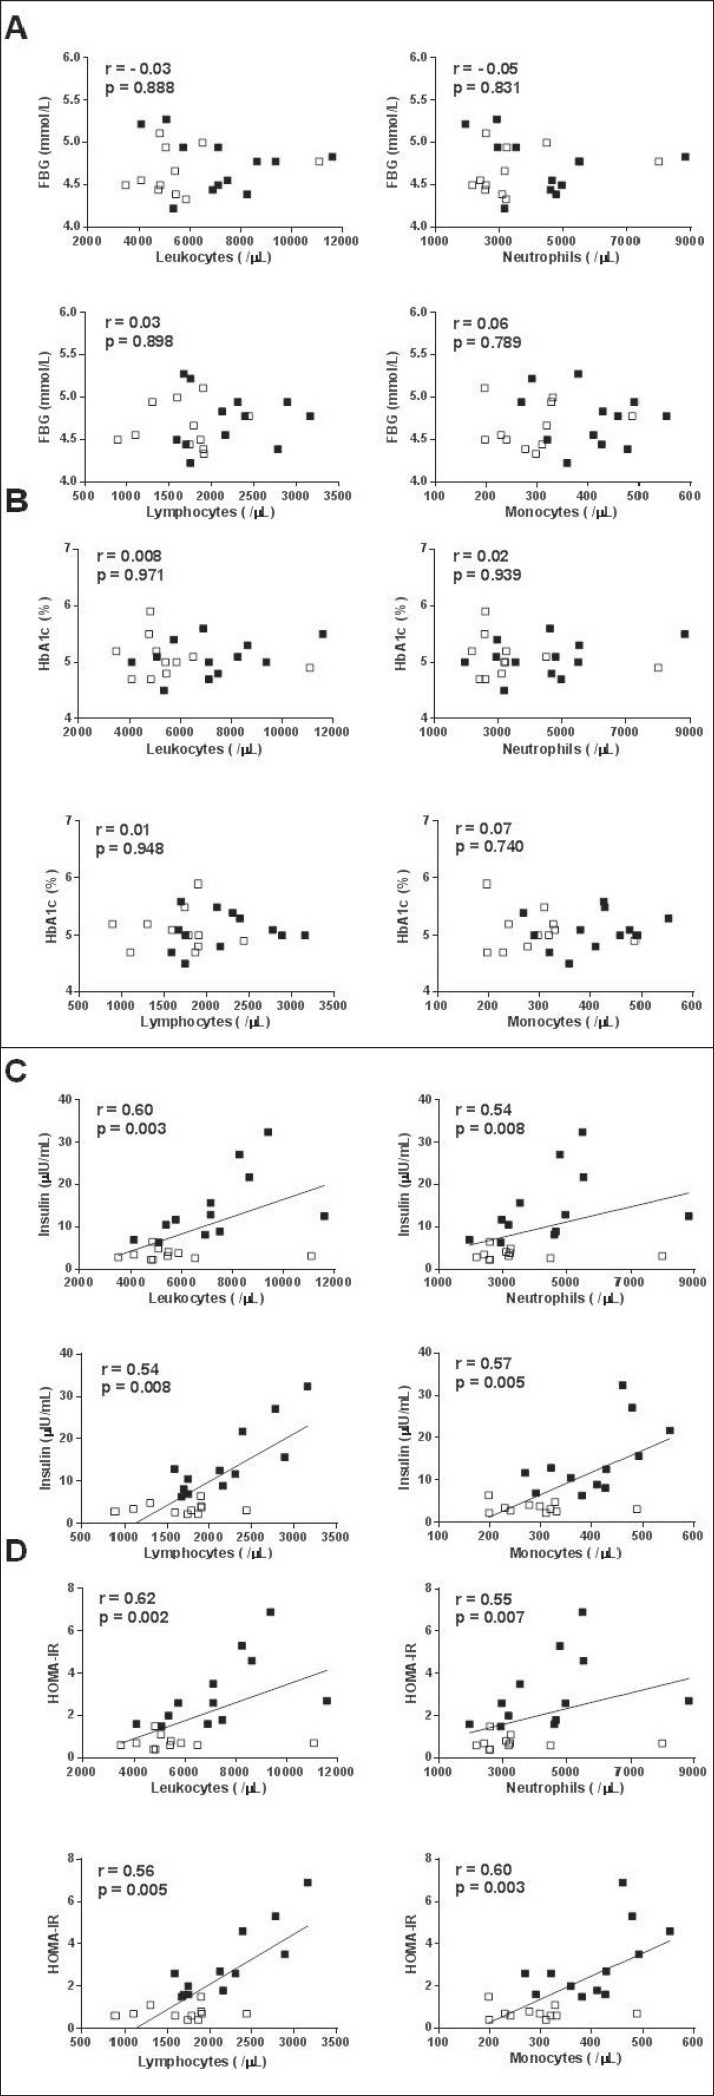
Fig. 2.
Correlation of peripheral total leukocyte, neutrophil, lymphocyte and monocyte counts with A fasting blood glucose (FBG), B hemoglobin A1c (HbA1c), C insulin, and D homeostasis model assessment of insulin resistance (HOMA-IR). Open squares represent control subjects. Closed squares represent obese subjects.

