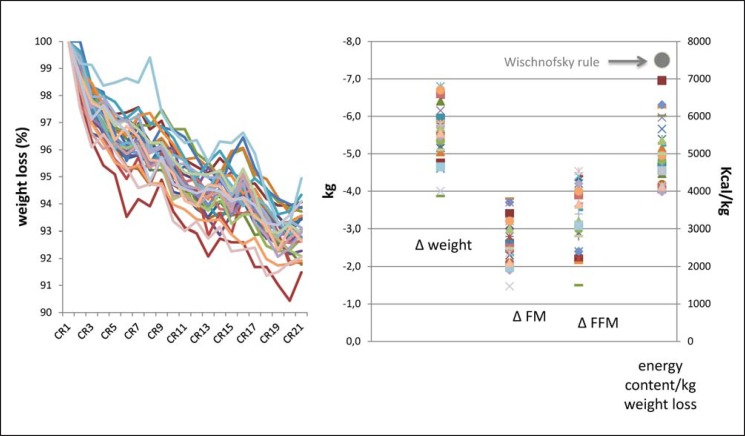
Fig. 5.
Individual time courses of weight loss (expressed as percentage of initial body weight) during 21 days of caloric restriction (CR) in response to CR at −50% of individual energy need. Individual day-to-day data on body weight (A) and variance in total changes (CR 21 - CR 1) in FM, FFM, and the energy content of body weight (C) in 32 healthy young normal-weight male volunteers. Despite the controlled approach, there is a considerable variance in weight changes and changes in either FM or FFM. Inter-individual variance in energy content of weight change was high but below the Wischnofsky rule (7,700 kcal/kg, black symbol [50]) suggesting a greater weight loss-associated decrease in FFM. The study protocol is described in detail, and the data were taken from [58].

