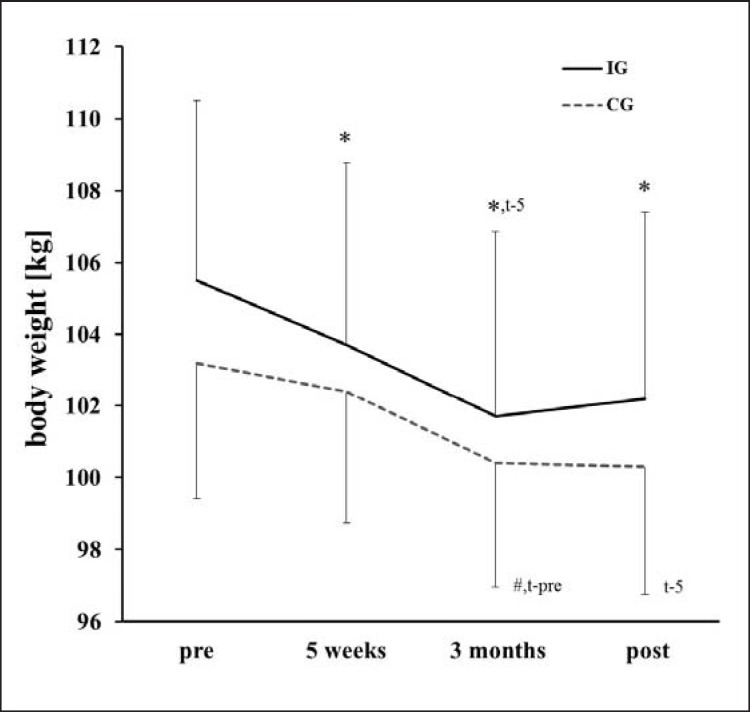
Fig. 2.
Weight loss over the course of the intervention for the intervention (IG) and the control group (CG). *Indicates differences with respect to pre (post hoc t-test with Bonferroni correction). #Indicates differences with respect to 5 weeks (post hoc t-test with Bonferroni correction). t-preDifferent by trend with respect to pre (post hoc t-test with Bonferroni correction). t-5Different by trend with respect to 5 weeks (post hoc t-test with Bonferroni correction).

