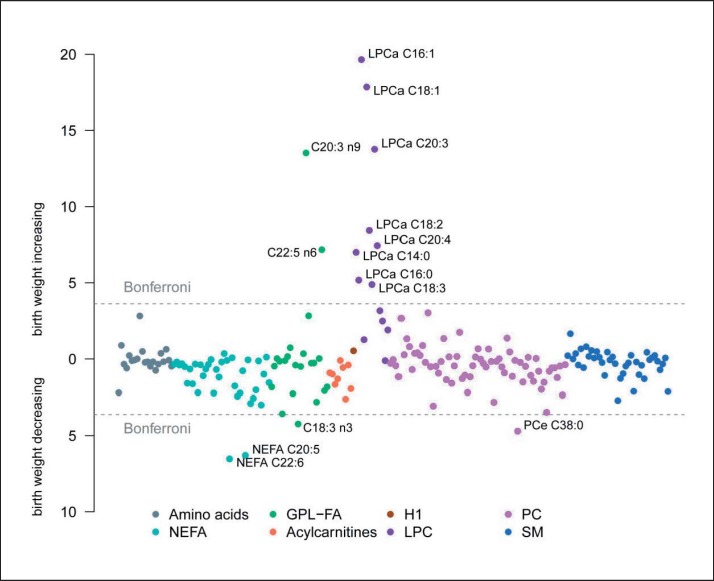
Fig. 1.
Birth weight associations. Manhattan plot of the association between birth weight and metabolites adjusted for study center, sex, gestational age, maternal BMI, weight gain during pregnancy, smoking in the third trimester and education. Cx:y = An acyl group of chain length x and y double bounds; NEFA = nonesterified fatty acids; GPL-FA = glycerophospholipid fatty acids; LPC = lysophosphatidylcholines; PC = phosphatidylcholines; SM = sphingomyelins. Bonferroni significance level of 2.39 ×10⁻⁴.

