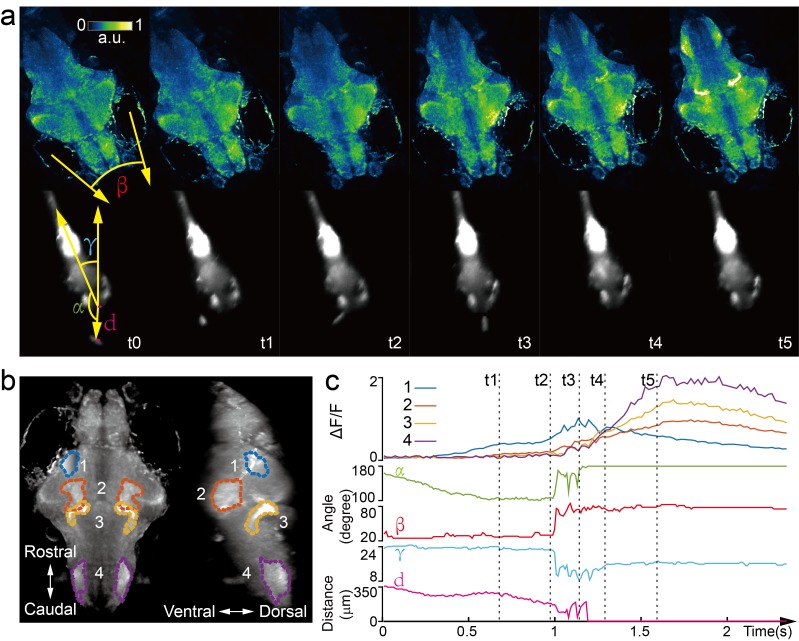
Figure 4. Whole brain imaging of larval zebrafish during prey capture behavior.
(a) Renderings of whole brain calcium activity at six time points (up) and the corresponding behavioral images (bottom). Features used to quantify behavior were: fish-paramecium azimuth α; convergence angle between eyes β; head orientation γ; and fish-paramecium distance d. (b) Maximum intensity projections of zebrafish brain with pan-neuronal cytoplasm-labeled GCaMP6s (huc:gcamp6s). Boundaries of four brain regions are color marked. (c) Neural dynamics inferred from GCaMP6 fluorescence changes in these four regions during the entire prey capture behavior (up) and the kinematics of behavioral features (bottom). Note that between t2 and t4, fish-paramecium distance d exhibits three abrupt kinks, representing the three attempts to catch prey.

