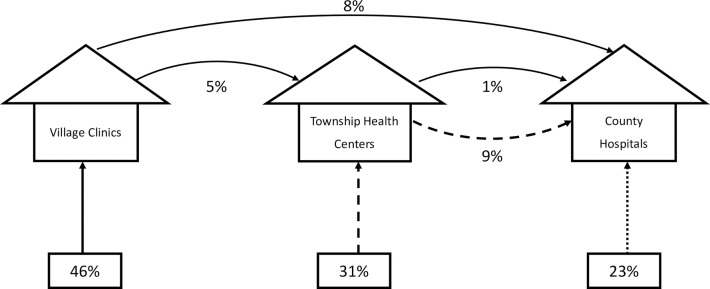
Fig 5. Estimated patient pathways under status quo (patients freely selecting into tiers).
Percentages at bottom of figure show the percentage of patients selecting into each health system tier based on survey responses (S5 Table). For each referral pathway, figure shows percentage of total patient population following each path calculated using SP results for subsample of complete health systems.

