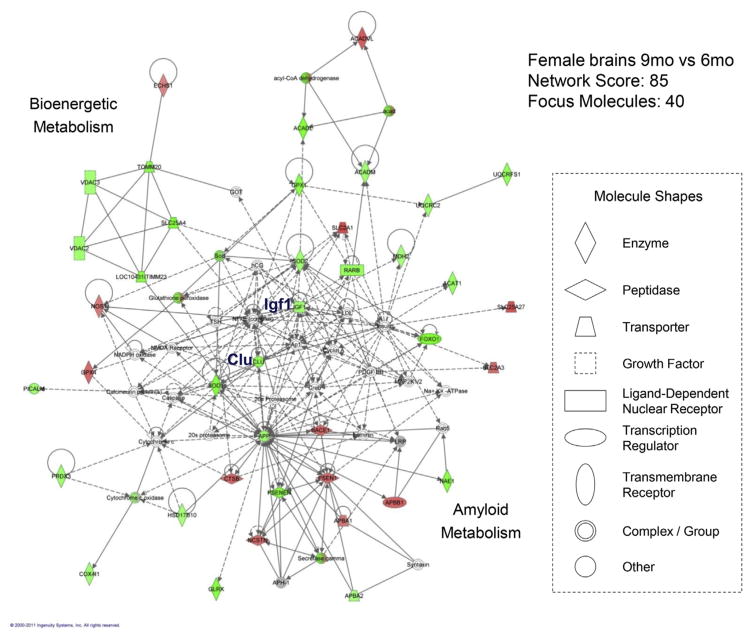
Fig. 4.
The IPA-derived molecular network with the most relevance to gene expression changes between the ages of 6 months and 9 months in female mice. Molecules (or nodes) in the network are displayed as various shapes that indicate the functional class. Focus molecules (colored molecules) refer to genes from the data set. Red indicates significantly upregulated genes (p < 0.05), green indicates significantly downregulated genes (p < 0.05), gray indicates nonsignificantly changed genes from the data set (p > 0.05), and white indicates molecules added from the Ingenuity Knowledge Base; color intensity indicates the degree of up or downregulation. Lines (or edges) connecting molecules indicate biological relationships; solid lines indicate direct interaction, dashed lines indicate indirect interactions, and circular lines indicate self-referential relationships that arise from the ability of a molecule to act on itself; the types of arrows indicate specific biological relationships and the directionality of the interaction. (For interpretation of the references to color in this figure legend, the reader is referred to the Web version of this article.)

