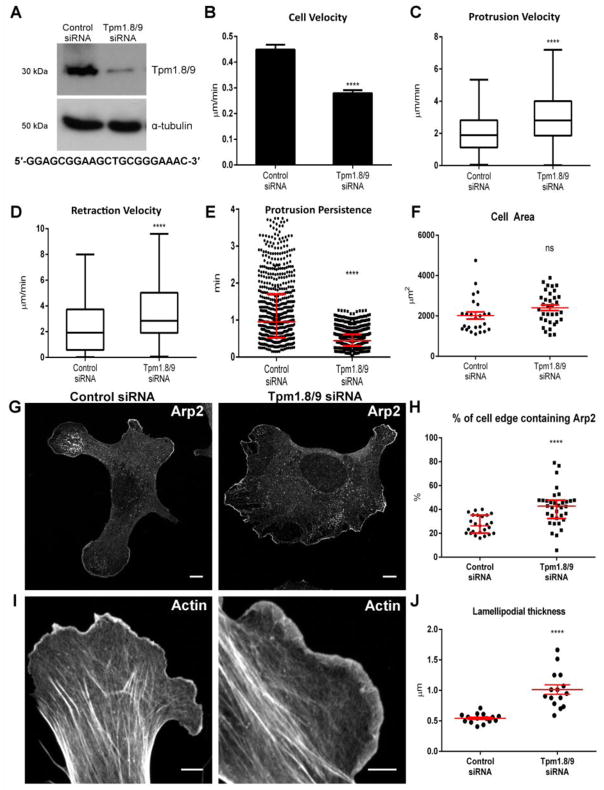
Figure 2. RNAi-mediated silencing of Tpm1.8/9 results in reduced in cell speed and lamellipodial persistence and leads to an increase of Arp2/3 accumulation at the cell periphery and (See also Figure S3).
(A) Western blot showing Tpm1.8/9 expression in MEFs 48 h post transfection with either control (non-silencing) or Tpm1.8/9 siRNA. α-tubulin was used as a loading control. Target sequence shown below blot.
(B) Histogram showing average (control, n = 79 cells; Tpm1.8/9 siRNA, n = 74 cells) cell velocity. Error bars = SEM; n = 4, ****p < 0.0001; Student’s t-test.
(C & D) Quantitation of kymographs (control, n = 228 kymographs generated for 30 cells; Tpm1.8/9 siRNA, n = 181 kymographs generated for 23 cells) showing the velocity of protrusions (C) and retractions (D). For Tukey box plots, whiskers indicate maximum and minimum values within 1.5 IQR, the box represents the 25th–75th quartile, and the line indicates the median. n = 4; ****p < 0.0001; Student’s t-test.
(E) Quantitation of kymographs showing protrusion persistence in Tpm1.8/9 treated cells compared to control siRNA treated cells. Error bars ± SEM; Control siRNA, n = 228 kymographs generated for 30 cells; Tpm1.8/9 siRNA, n = 181 kymographs generated for 23 cells; ****p < 0.0001; Student’s t-test.
(F) Quantitation of image analysis showing no significant difference in cell area in control siRNA compared to Tpm1.8/9 siRNA treated cells. Error bars ± SEM; n = 25; ns = not statistically significant; Student’s t-test.
(G) MEFs stained for Arp2, 48 h post transfection with either control (left) or Tpm1.8/9 siRNA (right). Scale bars = 10 μm.
(H) Quantitation of image analysis showing % of cell edge containing Arp2 is significantly increased in the knockdowns. Error bars ± SEM; n = 25; ****p < 0.0001; Student’s t-test.
(I) MEFs stained with Phalloidin, 48 h post transfection with either control (left, 2.0 x magnification) or Tpm1.8/9 siRNA (right, 2.6 x magnification). Scale bars = 5 μm.
(J) Quantitation of image analysis showing lamellipodial thickness is significantly increased in Tpm1.8/9 knockdown cells. Error bars ± SEM; n = 15; ****p < 0.0001; Student’s t-test.

