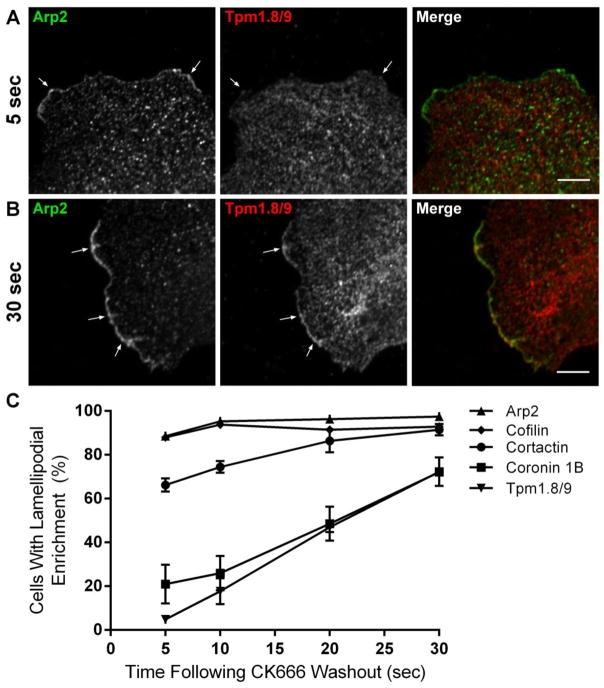
Figure 3. Sequence of appearance of other actin binding proteins following activation of the Arp2/3 complex.
Cells were treated with the Arp2/3 inhibitor CK666 at 150 μM for 3 hr, the inhibitor was then washed out and cells fixed at 5, 10, 20 or 30 sec.
(A) Representative confocal image of a newly formed lamellipodium in a MEF cell (3 x magnification), co-stained for Arp2 (green) and Tpm1.8/9 (red) at 5 seconds following washout of CK666. Scale bar = 5 μm.
(B) Representative confocal image of a newly formed lamellipodium in a MEF cell (3 x magnification), co-stained for Arp2 (green) and Tpm1.8/9 (red) at 30 seconds following washout of CK666. Scale bar = 5 μm.
(C) Quantitation shown as a percentage of cells displaying lamellipodial enrichment of the relevant protein at the various time-points following drug washout; Error bars ± SEM; n > 100 cells per antibody per time-point. n = 3.

