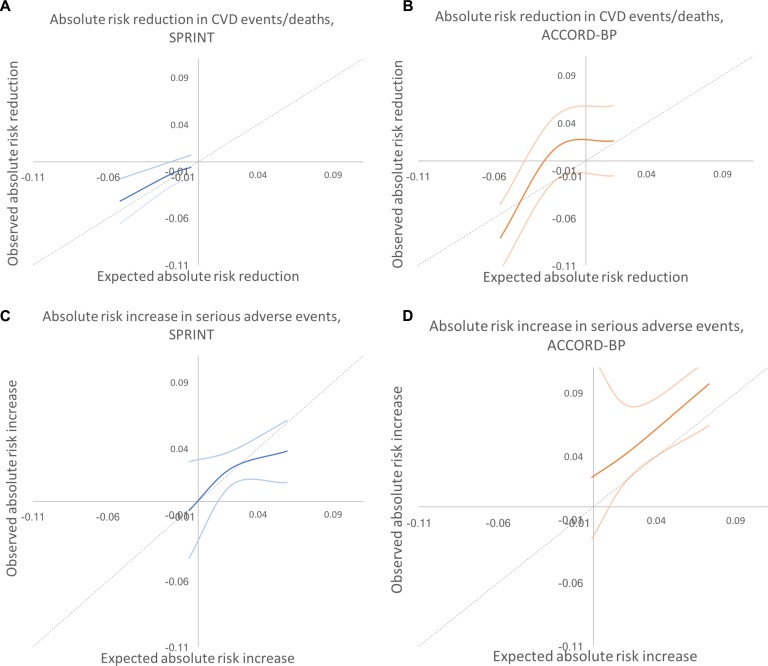
Fig 4. Predicted versus observed absolute risk differences in benefit and harm among SPRINT and ACCORD-BP trial participant subgroups, using predictions from the elastic net regularization model.
Dotted lines show the perfect predicted versus observed slope of 1. Dark colored lines show the mean of observed absolute risk differences, while light colored lines show 95% confidence intervals. (A) SPRINT, benefit. (B) ACCORD, benefit. (C) SPRINT, harm. (D) ACCORD, harm. CVD, cardiovascular disease.

