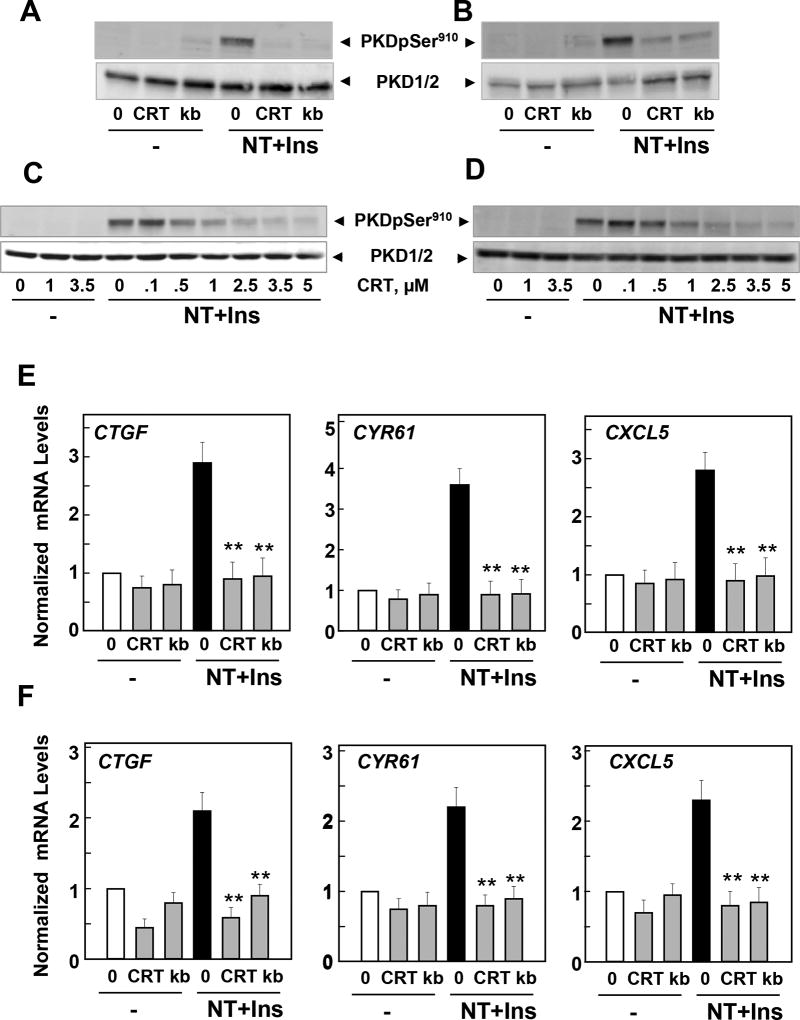
Figure 6. Neurotensin and Insulin induce CTGF, CYR61 or CXCL5 expression through PKDs in PDAC cells.
A and B, Confluent cultures of PANC-1 (A) or MiaPaCa-2 cells (B) were incubated in the absence (0) or presence of either 2.5 µM CRT0066101 (CRT) or 3.5 µM kb NB 142–70 (kB) for 1 h in DMEM prior to stimulation with 5 nM neurotensin (NT) and 10 ng/ml Insulin (Ins) for 10 min. Cultures were then lysed with 2×SDS–PAGE sample buffer and analyzed by immunoblotting with antibodies that detect PKD1 phosphorylated at Ser910 and total PKD1/2. Similar results were obtained in 3 independent experiments. C and D, Confluent cultures of PANC-1 (C) or MiaPaCa-2 cells (D) were incubated in the absence (0) or presence of increasing concentrations of CRT0066101 (CRT) for 1 h in DMEM prior to stimulation with NT+Ins for 10 min. PKD1 phosphorylation was determined as above. E and F, Confluent cultures of PANC-1 (E) and MiaPaCa-2 cells (F) were incubated in the absence (0) or presence of either 2.5 µM CRT0066101 (CRT) or 3.5 µM kb NB 142–70 (kB) for 1 h in DMEM prior to stimulation with NT+Ins for 60 min. RNA was isolated and the relative levels (n=3) of CTGF, CYR61 or CXCL5 mRNA compared with 18s mRNA was measured by RT-qPCR. Data are presented as mean ± SEM. Similar results were obtained independent experiments. Treatment with CRT0066101 or kb NB 142–70 significantly decreased relative mRNA levels of CTGF, CYR61 or CXCL5 as compared with untreated NT+Ins, **P < 0.01 as shown by one-way ANOVA with Bonferroni t-test.

