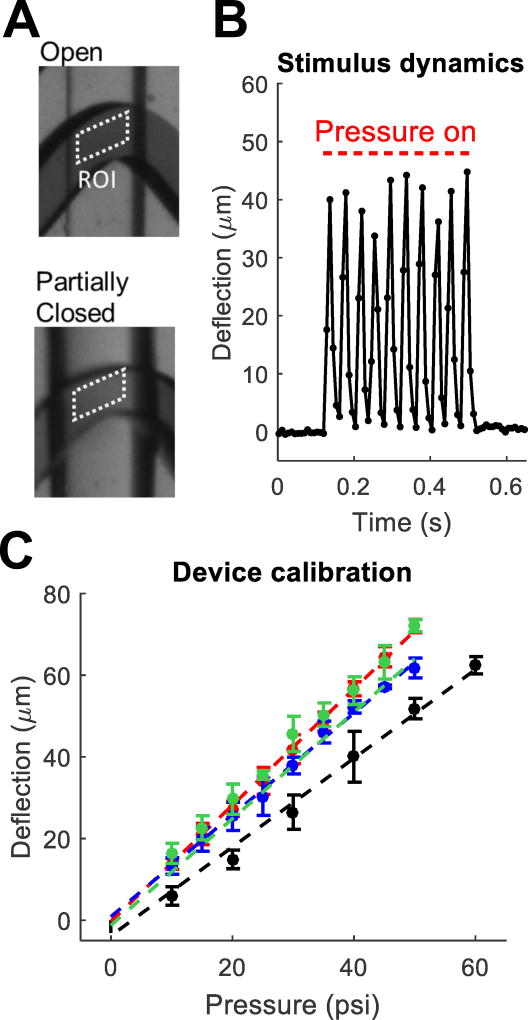
Fig. 2.
Stimulus measurement and calibration. (a) Optical transmission of dye-filled touch valves is used to monitor worm channel height in the valve. (b) Worm channel ceiling deflection when control solenoid is driven by a 25 Hz square wave with an amplitude of 40 psi and a 50% duty cycle. Red lines denote pressure on. (c) Maximum deflection as a function of pressure. Points (mean ± SD) show the average of 3–5 trials. Colors show 4 different devices.

