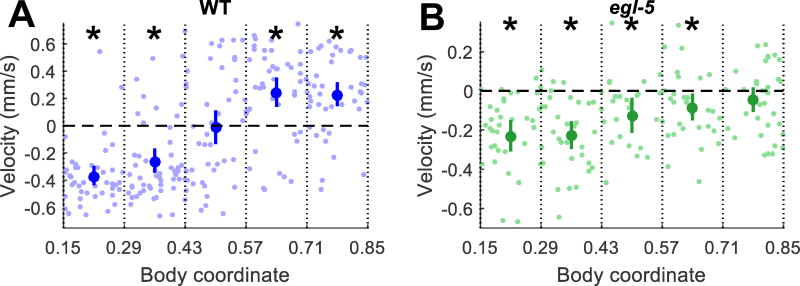
Fig. 4.
Gentle touch response fields. For both plots, responses are grouped into five bins by body coordinate (0 = head, 1 = tail) of the center of stimulus. Average ± 95% CI of the mean is plotted for each bin. Asterisks denote significant difference from zero for the responses in the bin (Z test, p < 0.05 after Bonferroni correction). Pale dots show responses of individual animals. (a) Velocity of WT animals after gentle touch stimuli. (b) Velocity of egl-5(u202) animals after gentle touch stimuli.

