Figure 2.

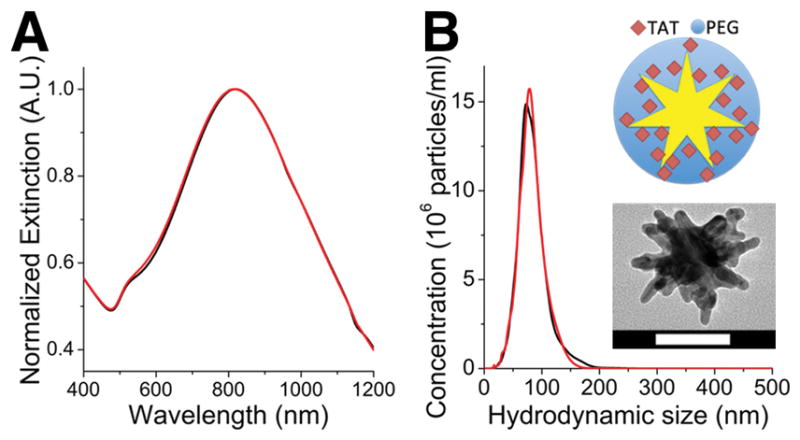
(A) Normalized extinction spectra of PEG-GNS (black) and TAT-GNS (red). (B) Hydrodynamic size distribution of PEG-GNS (black) and TAT-GNS (red). (inset) Illustration and TEM image of TAT-GNS. Scale bar is 50 nm.

(A) Normalized extinction spectra of PEG-GNS (black) and TAT-GNS (red). (B) Hydrodynamic size distribution of PEG-GNS (black) and TAT-GNS (red). (inset) Illustration and TEM image of TAT-GNS. Scale bar is 50 nm.