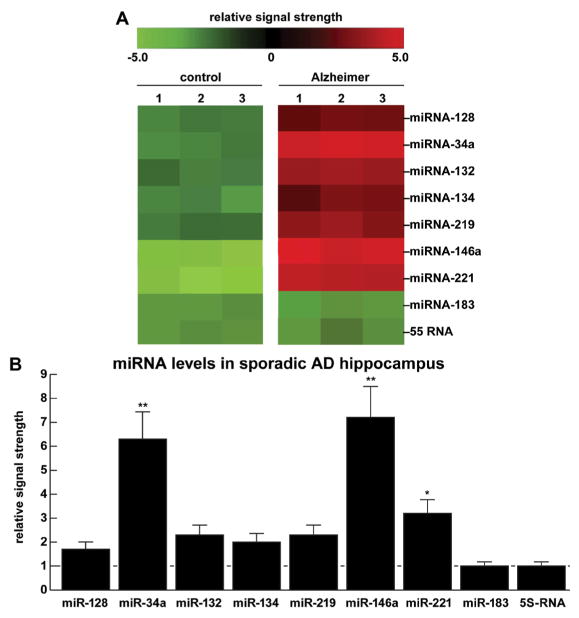
Figure 1.
(A) Color-coded cluster analysis of a small family of up-regulated miRNA species in the hippocampal CA1 region of 9 pooled control and 9 pooled moderate-to-late-stage AD cases; [experiments performed in triplicate (1–3) age range for AD and control cases 54–72 year; all females; controls mean +/−1 SD=63.0+/−8.9 year; AD mean +/−1 SD=64.8+/−10.2 year]; miRNA levels analyzed in triplicate [1–3] using RNA sequencing, LED Northern and/or microfluidic miRNA arrays (LC Sciences, Houston TX) [1,4]; these up-regulated miRNAs include, prominently, miRNA-34a and miRNA-146a, two pathogenic miRNAs known to be linked to the innate-immune response, the propagation of inflammatory neurodegeneration, altered synapto-genesis and amyloidogenesis [10–13]; analogous studies in mild cognitive impairment (MCI; a potential ‘precursor’ to moderate-to-late-stage AD) tissues may be further useful in expanding our understanding of the evolution and establishment of miRNA-mRNA coupled signaling networks; control miRNA-183 and the small structural 5S RNA did not change under these conditions and were used as internal control markers in the same sample; (B) quantification of data in bar graph format; interestingly miRNA-34a and miRNA-146a (established markers for human pro-inflammatory neurodegeneration) are also seen to be significantly up-regulated in other neuropsychiatric disorders including autism spectrum disorder (ASD) and prion disease [12–21; unpublished]; we have additional evidence that up-regulated miRNA-34a and miRNA-146a down-regulate expression of SHANK3, a scaffold protein essential for synapse formation and communication between neurons, and a contributor to the AD phenotype and related neuropsychiatric disorders (Figures 2 and 3; 21,22; unpublished); in these experiments there was no statistical difference between control and AD mean age, gender, PMI or RNA quality; in (B) horizontal line at 1.0 for ease of comparison against controls; N=3; *p<0.05; **p<0.01 (ANOVA).

