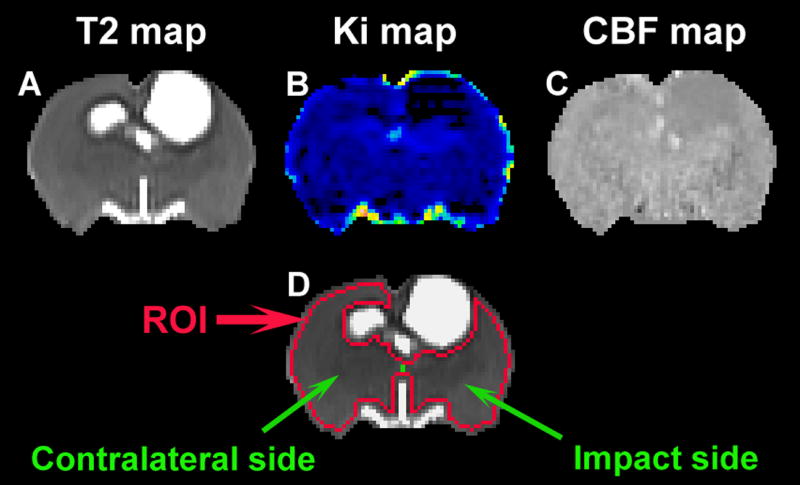
Fig. 1. A representative slice of cell-treated animal showing T2 (A), Ki (B), CBF (C) maps and ROI (D).
TBI-induced disturbance is apparent around the impact site on each of specific maps (A–C). Based on T2 map, the ROI (D, red track) encompassing the normal-appearing brain tissue is created and is divided to two parts (D, green line), impact side and contralateral side (D, indicated by green arrows).

