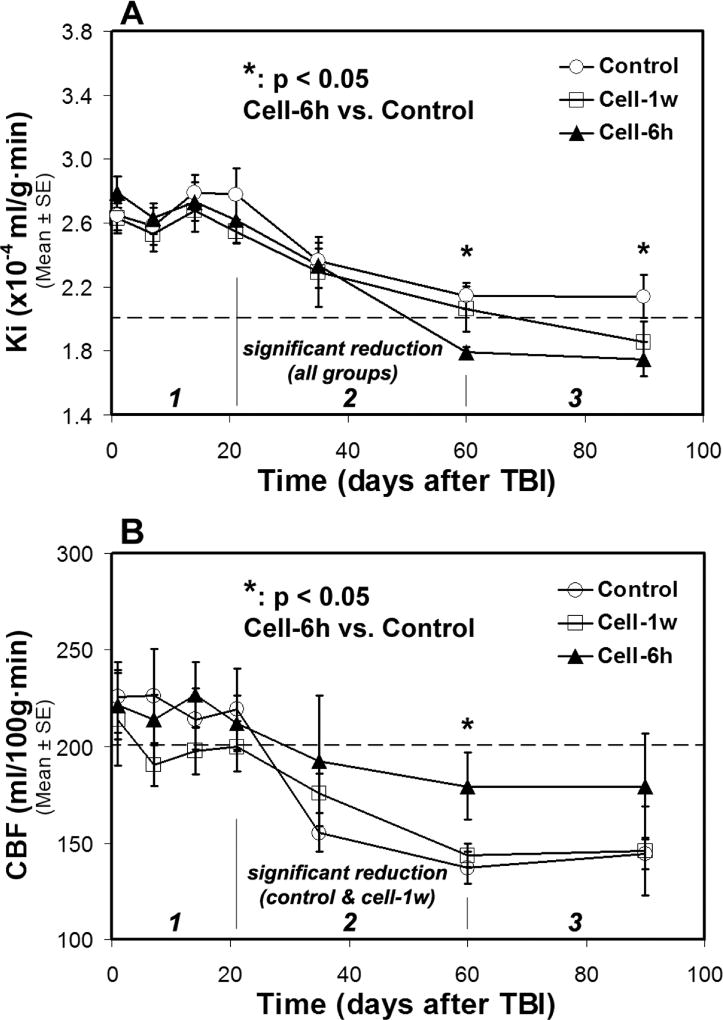
Fig. 5. Changes of Ki (A) and CBF (B) in ROI encompassing both sides of normal-appearing brain tissue.
A three-stage evolution pattern of Ki and CBF along with time after TBI was revealed. Both Ki and CBF decrease in stage 2, while these measures fluctuate in stage 1 and tend towards stability in stage 3 for each treatment group. Cell engraftment expedites the reduction of Ki and retards the diminution of CBF in stage 2, resulting in lower Ki and higher CBF values in stage 3 compared to saline administration. The dotted lines represent the Ki and CBF values in the normal rat brain.

