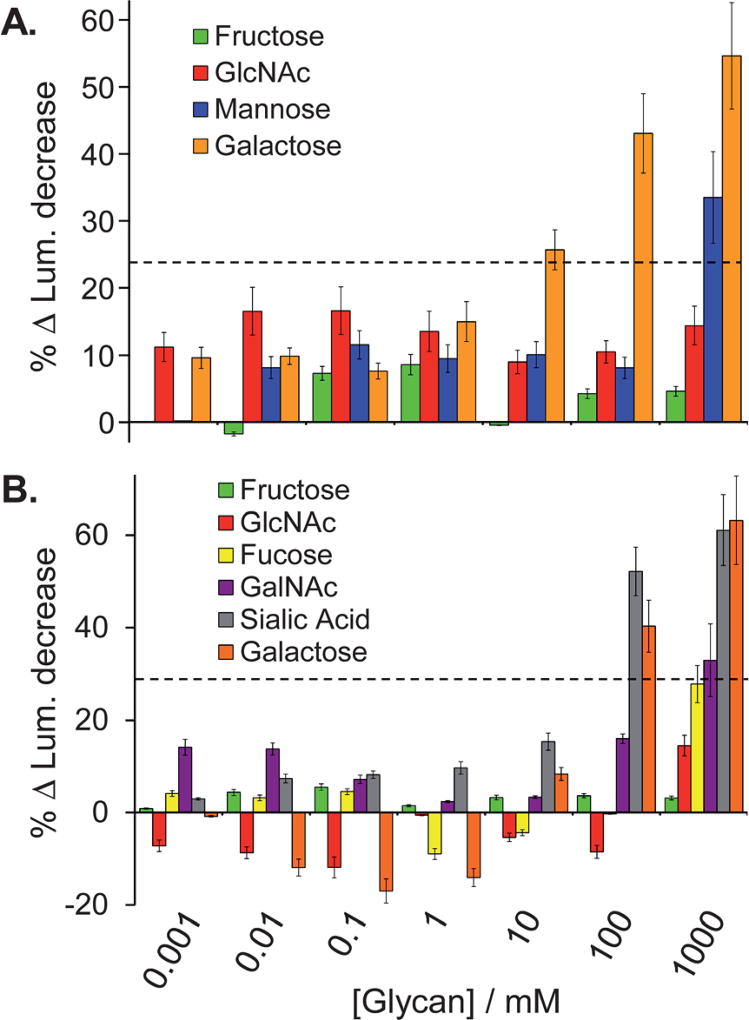
Fig. 3.
Percent change in luminosity for the glycan competition studies used to explore the SL2-OVA (A) and SL5-PSM(B) binding interactions (analyte identification indicated in the legends above). Error bars represent the standard error of the percent change relative to the control as this propagated uncertainty is based on the variance between replicate measurements for the sample and control reference. The dashed lines in each panel indicate a competition threshold, based on three standard deviations above the noise. Signal response above this threshold indicates significant competition.

