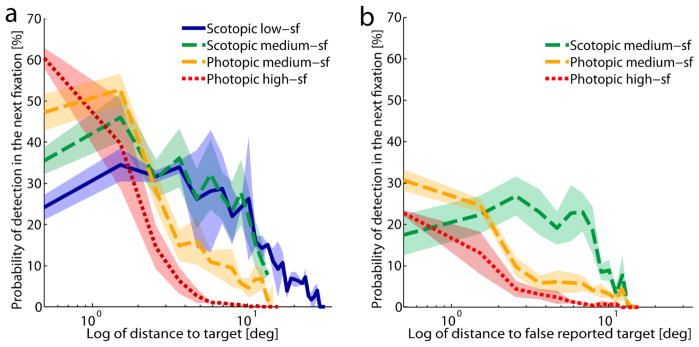
Figure 7.
a) Probability of detecting the target in the upcoming fixation (n+1) in percent as a function of the distance to the target at the location of the current fixation (n) for successful trials (hits). The probability was calculated from the ratio between the frequency of distances from the second last fixation location to the target and the frequency of distances of all other fixations. Distances were binned in steps of 1°, bins with fewer than 10 trials were excluded. Error bands show ± 1 SEM. b) Probability of (incorrect) target detection in the upcoming fixation (n+1) in percent as a function of the distance to the false reported target location of the current fixation (n) in incorrect trials (misses). The probability was calculated as in a), but for the distance to the erroneously reported target location, not the true target location. The scotopic low-sf condition is not presented in this graph because there were too few error trials. Error bands show ± 1 SEM.

