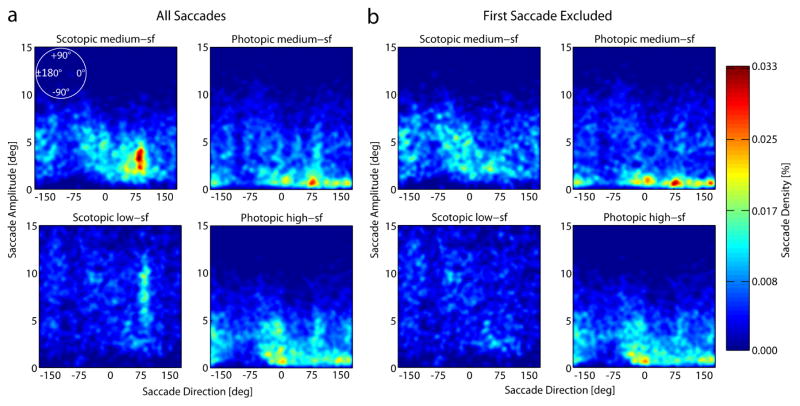
Figure 8.
Density of saccade amplitudes as a function of saccade directions across the search display (zero indicates saccades directed horizontally to the right, positive numbers: counter clockwise; negative numbers: clockwise). The number of saccades of a given amplitude and direction increases from dark blue to red. a) Density of saccade amplitudes as a function of saccade directions aggregated across all observers and trials in each of the four different conditions (scotopic medium-sf, photopic medium-sf, scotopic low-sf and photopic high-sf from top left to bottom right). Plots are based on a total of 23.969 saccades. b) Shows the same data but the first saccade that was made in each trial was excluded. For better comparison between conditions we normalized the data in each condition by the total number of saccades in that condition (for B by the total number of saccades included in the analysis). Density plots were smoothed with a Gaussian low-pass filter (σ = 2 deg).

