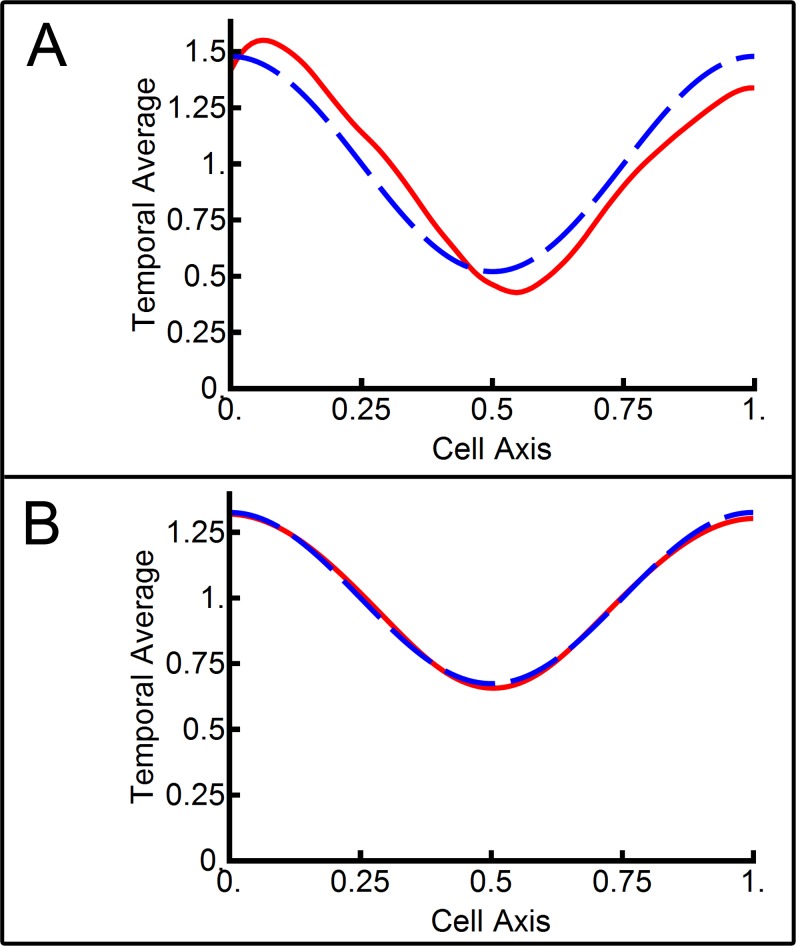
Fig 4. Temporal averages of the Min protein system.
The temporal average of total MinD as a function of position along the cell axis is shown in the dashed blue line. The contribution of the second-order mode to the mid-cell minima is shown in the solid red line. (A) The temporal average of the third experimental kymograph from Fig 2. (B) The temporal average of the middle line of simulation from Fig 3.

