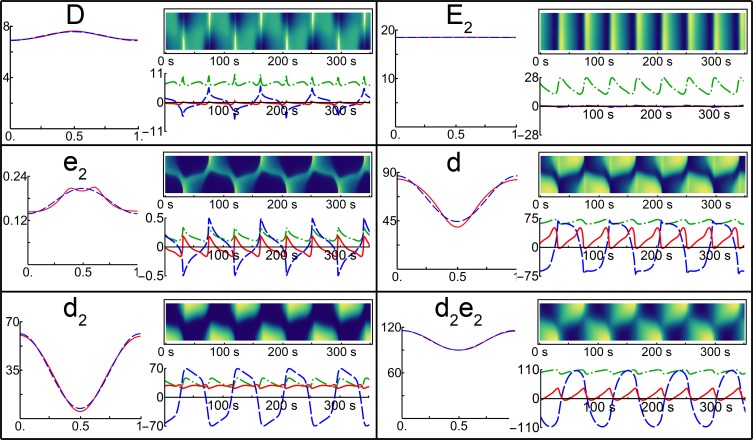
Fig 5. Fourier analysis of individual species.
Kymographs and corresponding Fourier analysis for the individual species of the Min model when simulated with a cell of length 3.5 μm for 350 s are shown on the right-hand side of each panel. Under each kymograph the dashed blue line shows the first-order mode, the solid red line the second-order mode and the dot-dashed green line represents the zero-order mode (the temporal variation in concentration). The temporal average of each species as a function of position along the cell axis is shown on the left-hand side of each panel in the dashed blue line with the second-order mode contribution shown in the solid red line.

