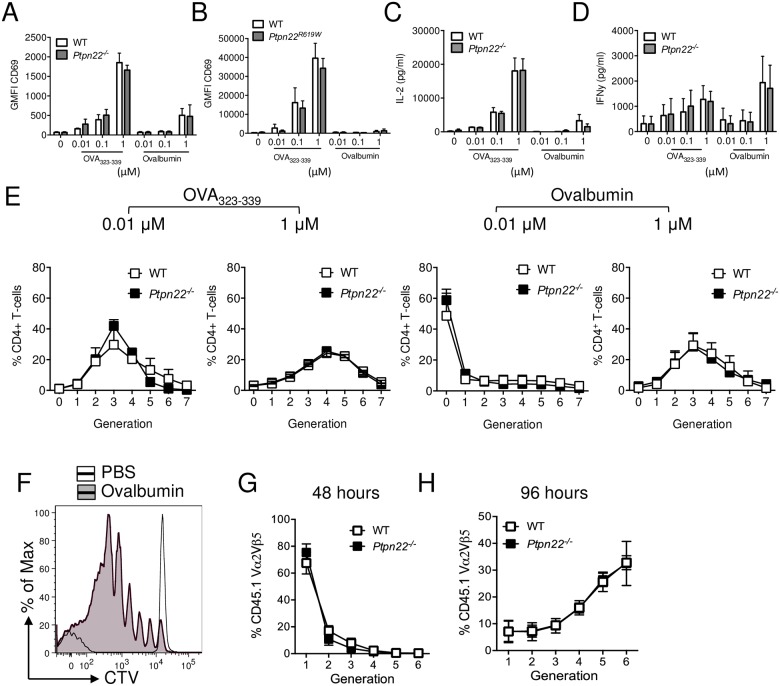
Fig 5. Ptpn22 variants do not modulate BMDC dependent OT.II T-cell activation.
(A-E) Wild type (WT), Ptpn22-/- and Ptpn22R619W BMDC were stimulated overnight in the presence or absence of OVA323-339 (0.01–1 μM) or ovalbumin (0.01–1 μM). BMDC were harvested and co-cultured with CellTrace Violet (CTV) labelled CD4+ OT.II T-cells at a 1:2 BMDC:T-cell ratio. (A-B) 24 hour Geometric Mean Fluorescent Intensity (GMFI) surface expression of CD69 determined on live, singlet, CD4+ T-cells. (A) N = 3 independent experiments and (B) N = 4 independent experiments; bars represent mean ± s.d. (C-D) Co-culture supernatants were assessed for (C) IL-2 after 24 hours and (D) IFNγ after 144 hours. N = 3 independent experiments; bars represent mean ± s.d. (E) At day 6 the proportion of CD4+ T-cells within each CTV generation was determined by flow cytometry. N = 3 independent experiments, lines represent mean ± s.d. (F-H) CTV labelled CD45.1+ CD4+ TCR Vα2+Vβ5+ OT.II T-cells were adoptively transferred i.v. into CD45.2+ WT or Ptpn22-/- recipient mice followed by i.p. immunisation of PBS or ovalbumin (100 μg/mouse). Spleens were assessed after 48h (G) or 96h (F, H) for CTV dilution within the CD45.1+ CD4+ TCR Vα2+Vβ5+ population by flow cytometry. (F) Representative flow cytometry plot showing CTV dilution following i.p. of PBS (black dashed line) or 10 μg ovalbumin (black line, grey fill). (G-H) Lines represent mean ± s.d., N = 3 (G) and N = 5 (H). Differences between genotypes (A-E, G, H) were deemed non-significant by two-way ANOVA with Sidak’s Multiple comparison test.

